A September Rally?
It’s probably safe to say that stocks have been stronger than many people expected – me included.
Yes, we did get a ~5% decline for the S&P 500 in August. And yes, tech stocks got the worst of it. Tesla (NASDAQ: TSLA) got whacked for -28% from its July 21 high near $300 to an August 18 low at $215. Apple (NASDAQ: AAPL) lost 10% during that time.
AMD (NYSE: AMD) peaked back in June – right about the time I was telling you to Take the Summer Off – and it fell from $132 to down to $102, a 27% drop that included several nasty $8-$10 one-day drops.
And yet through all the weakness, the S&P 500 never really got close to the range I was expecting.
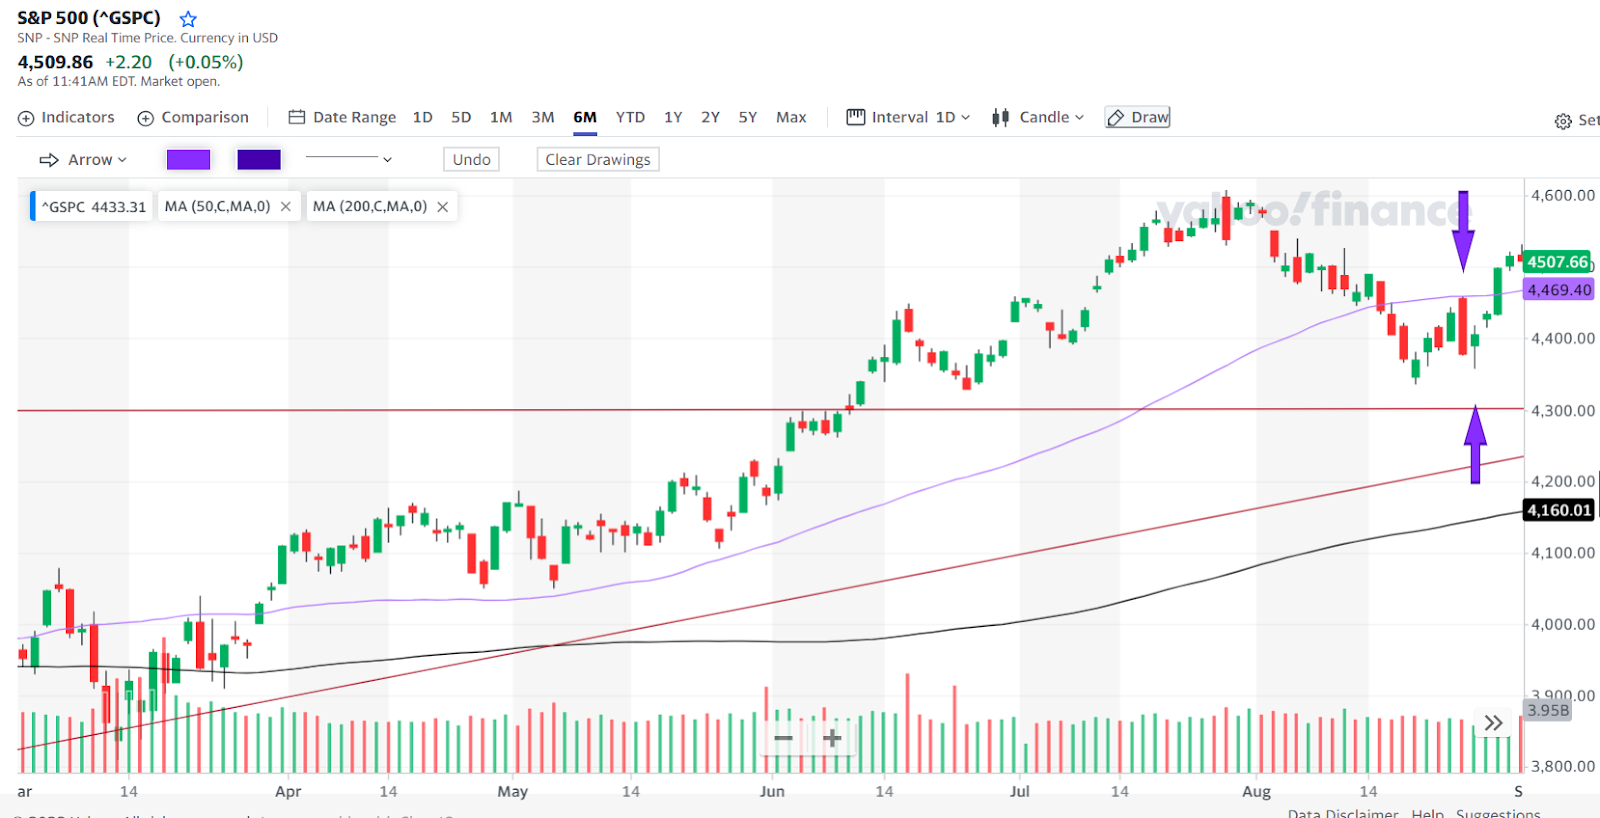
I’m gonna talk about those two big purple arrows in a minute. But first let me set the stage…
You may recall – starting in late June, I was expecting the S&P 500 to move down into the zone between the two redlines on this chart. The lower rising red line denotes the uptrend formed by the October 2022 lows. The upper red line denotes the support/resistance line created by the June 8 bull market breakout.
Yes, the S&P 500 fell through its 50-day moving average (purple line) in mid-August. But it found support pretty fast and has now powered right back above it, signaling that the medium-term uptrend is intact.
The rising red trendline now sits at ~4,250. And the S&P 500 is just above 4,500. A 5.5% decline for the S&P 500 would test the rising trendline. 5.5% – nowhere close to a full correction.
And that’s kind of my overall point today. The bears had a gift-wrapped opportunity to get some serious selling going. It was wrapped in shiny paper with giant bows and flashing red lights: sell! sell! sell!
And a 5% decline was all they could muster.
Kind of embarrassing if you think about it.
Back to Your Cave, Bear!
It was maybe 10 years, before my kids left the house for college. We were watching a documentary about this guy who travel to a certain spot in Alaska to camp near actual brown bears. I guess he spent 4 or 5 summers camping up there. He had names for some of the bears, wrote about their activity in a little notebook, and I guess he filmed himself and narrated too.
It was pretty clear he felt the bears had accepted his presence. He talked like they were his friends, even family…
They weren’t. They ate him. Because they’re bears.
Now, I’m not in the habit of basing my analysis about the stock market on NetFlix documentaries about stupid people. Still there’s a lesson here, and I think it should be pretty obvious what it is…
Today is September 1. This whole week, I haven’t read a single article about stocks that didn’t say “We are entering the seasonally worst period of the year for stocks, September and October…”
As if everything just goes straight to hell in a bucket starting today.
I don’t know all that much about actual bears. Like, I don’t know exactly when bears go into hibernation. But I know it’s not now. (For the record, I could query the google for that info, but I’m not going to because this is an analogy – it doesn’t have to be factually correct.)
And so I’m not going to tell you the market is of the woods (where the bears live) just yet. But at the same time, I don’t think this little rally we’ve got going is done just yet. In fact, I think the next couple of weeks are going to be kinda fun as stocks move higher and the stock market bears get increasingly agitated because stocks aren’t selling off in September like they’re supposed too…
About Those Purple Arrows
Those purple arrows point at Thursday and Friday of last week. Thursday was the market’s reaction to Nvidia’s (NASDAQ: NVDA) earnings, reported after the closing bell on Wednesday. And Friday was the day Fed Chair Powell read his little speech at the Jackson Hole economic shindig.
First up, Nvidia. They blew the doors off second quarter earnings, making it two straight quarters of ridiculous growth. The demand for Nvidia’s graphic processors (GPUs) that power the massive AI machines is truly off the chart.
After a nice rally that lifted the S&P 500 by 49 points to close at 4,436 close on Wednesday, the S&P 500 gapped up another 20 points to open Thursday at 4,455.
As you can see on the chart, that gap higher meant that the S&P 500 opened for Thursday trading right at its 50-day moving average (purple line). And then it got crushed, selling off pretty much all day and closing right on its lows, at 4,376.
Thursday had everything the bears wanted to see. A gap higher that failed. A failed attempt to break over the 50-day MA. A failure by the greatest stock ever in the history of mankind (JK) to hold gains after a great earnings report.
And closing on the lows after an all day sell-off, well, that’s practically a guarantee that the market is reversing. And I saw plenty of commentary that yes, the market was definitely headed to new lows.
But, it’s like nobody can remember that today’s daily trading environment is dominated by machines running trading algorithms. Over 70% of daily trades on the New York Stock Exchange (NYSE) are executed by machines.
The algorithms they run are mainly a string of “if/then” statements. Like “if the S&P 500 gaps up to the 50-day MA, then sell.” What’s more, these algorithms are not designed for long-term investing. They are designed to make a few percent profit each and every day.
And this means two things. One, when the machines start marching in lockstep, you either stand out of the way or get steamrolled. The only thing that will stop them from grinding prices lower is the closing bell.
And two, the machines don’t necessarily have a memory that lasts more than a day. This is just an observation, but they seem to have no problem trading lower on one signal one day, and then rallying the next day on a different signal.
Which brings us to that second purple arrow…
I know Fed Chair Powell’s Jackson Hole speech has been analyzed to exhaustion. Was it a threat of more rate hikes? Did it promise a pause at the FOMC meeting later this week?
Well, the machines certainly liked it. And the odds of a September rate hike have dropped from ~80% last week to around 10% this week.
In other words, it sure looks like the “Powell signal” overrode the machines’ “50-day failure” signal.
The S&P 500 blasted through the 50-day MA on Tuesday. It now sits at ~4,510. The 52-week high is 4,607. Don’t be surprised if the S&P 500 makes a run at that 52-week high between now and the next Fed meeting on September 20.
That’s it for me today, take care, have a great weekend and I’ll talk to you on Monday…
Briton Ryle
Chief Investment Strategist
Pro Trader Today
brit.ryle@protradertoday.com
Facebook: https://www.facebook.com/ProTraderToday
Twitter: https://twitter.com/BritonRyle