Tomorrow's Trading Plan
Back on January 4 and January 7, I was looking at the potential for the stock market to put together a decent rally.
Well here we are on January 16 and stocks have been acting downright frisky. Earnings season has just started and big banks JP Morgan (NYSE: JPM) and Bank of America (NYSE: BAC) posted pretty good numbers. And the most recent inflation and employment data didn’t include any nasty surprises…
That was enough to ramp the S&P 500 right up to its 200-day moving average. Here’s the updated chart that we’ve been following:
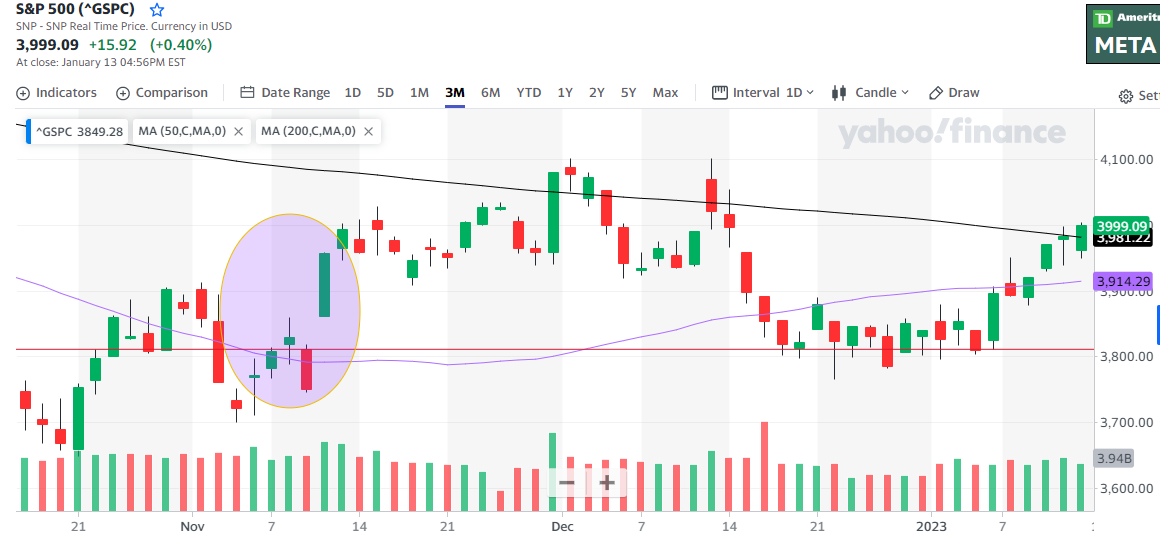
As you can see, over the last 6 trading days, the S&P 500 has bounced off support at 3,818 (red line), cruised through the 50-day Moving Average (MA) at 3,914 (purple line), and, on Friday, managed to close above the 200-day MA (black line) which sits at 3,981.
That’s a 4.7% move in 6 days, pretty darn good. And it could get better…
The 200-day MA is generally considered the long-term trend line. When the S&P 500 drops below the 200-day MA, it is viewed as confirmation that the long-term trend is lower. So of course, the S&P 500 moving above the 200-day MA is viewed as confirmation of an uptrend.
Now, the S&P 500 fell below the 200-day MA (at 4,500) back in April 2022, when it became clear that inflation was exploding higher and the Fed was woefully behind the curve in combating it. Bigger rate hikes were coming and the downtrend began.
The S&P 500 has only made two forays above the long-term trendline since – the first on November 11 and the second on December 16. As you can see on the chart above, both of these rally attempts failed pretty dramatically. And yes it is too early to say for sure that the current move above the 200-day MA will hold…
But given the recent inflation data, the market expects that the Fed will pause after two more small rate hikes. And investors will be paying more attention to earnings over the next couple of weeks. Conditions look favorable for the S&P 500 to take a run at those recent highs at 4,100.
Tomorrow’s Trading Plan
I’ve told you that I like Amazon (NASDAQ: AMZN), Meta (NASDAQ: META) and Rivian (NASDAQ: RIVN) as upside trading stocks.
I did well with Amazon last week as it jumped over its 50-day MA. The stock is just over $98. I wouldn’t expect it to move over $100 on its first attempt, but when it does, another 10% run to fill the gap at $110 looks doable.
I was doing well with Rivian before the stock got crushed on Friday. But I won’t hesitate to jump back in because I still think the stock can ramp to $20 in the blink of an eye…
But the first thing I do tomorrow morning is grab some Jumia Technologies (NASDAQ: JMIA) call options. My spidey-sense tells me that an explosive move is likely…
And if you don’t trust my spidey-sense, take a look at how many call options were bought on Friday at the 4 and 4.50 strike prices…

Nearly 20,000 contracts at the 4 and 4.50 strikes were bought on Friday. This is very much a “where there’s smoke there’s fire” situation. I don’t know what’s driving the bullishness, but I’ve followed the stock long enough to know that Jumia can bust a 20-25% move in a couple days.
Now, it might seem weird to buy call options on a $4 stock. But if Jumia does indeed make a run to $5, those 4 strike calls that closed Friday at ~$25 will be worth at least $100. That’s my plan and I’m sticking to it. But please note: the calls I’m looking at expire on Friday, January 20, so there’s not a lot of wiggle room. You can manage risk by going out another week and get calls that expire January 27, or just trade the stock.
That’s it for me today, enjoy the rest of your day off, and I’ll talk to you on Wednesday…
Briton Ryle
Editor-in-Chief
Pro Trader Today