Forewarned is Forearmed
Like most people, I have dabbled with a few different AI applications. Like, I’ve asked ChatGPT to synthesize a few images that I wanted – images that would’ve taken me hours of Photoshop-style cutting & pasting to create…
I’ve sampled AI versions of a couple business partnership agreements. And I’ve asked AI to perform various research tasks…
The results have been…acceptable, I guess.
But I have found one AI style data service that I’ve been using for my trading, with some pretty incredible results. Let me show you…
I’ll start with the chart for the S&P 500. For this view, I selected 10 years of data to chart the S&P 500 index, and I highlighted the period to look at with just a couple mouse-clicks:
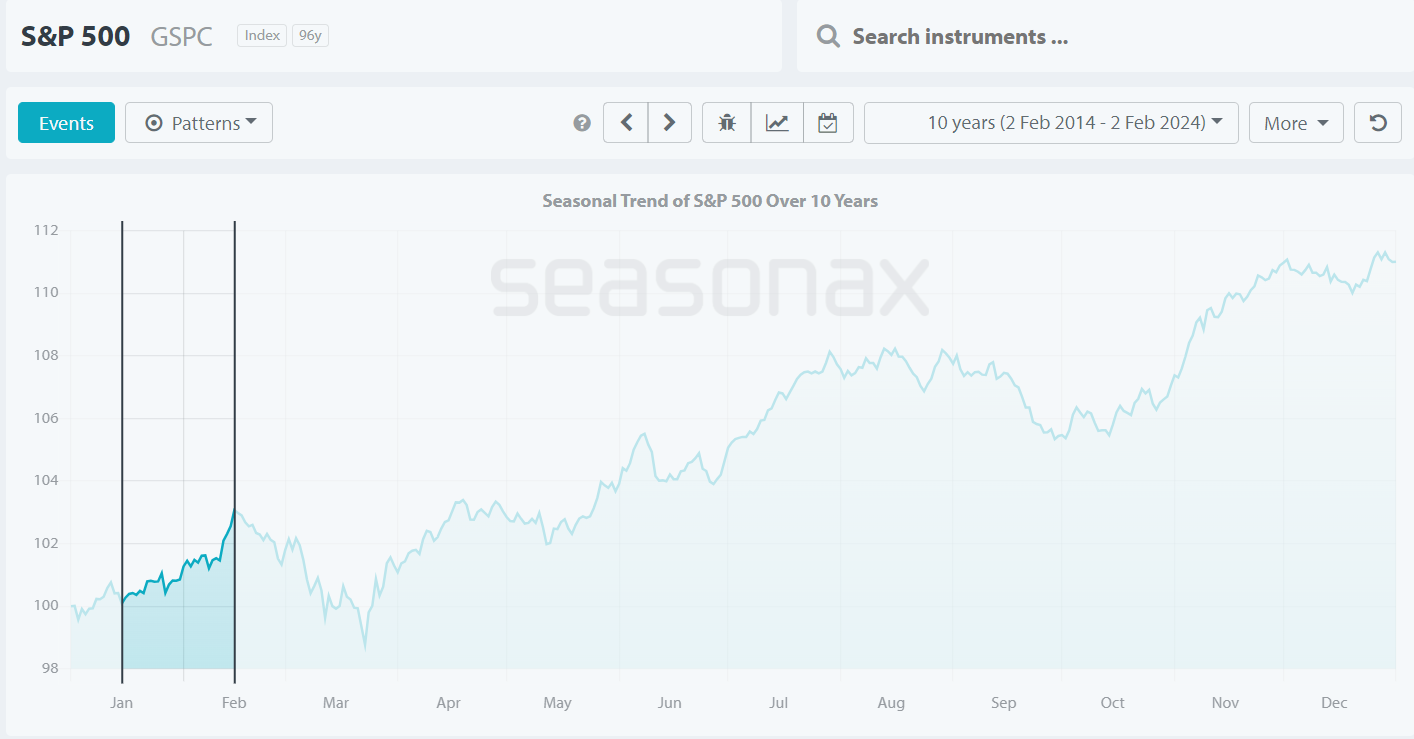
That highlighted area is the S&P 500 between January 15 and February 15. Looks like a nice rally right? Well, this program also offered up statistics for this specific time period. Here’s what the stats said:
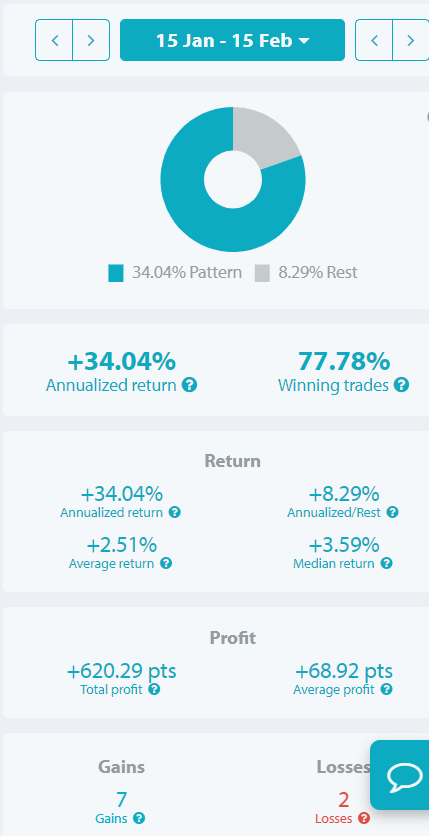
The stats said that the S&P 500 had a 77.78% chance of rallying between January 15 and February 15. And the Average Return is 2.5%.
Now, let’s have a look at what actually happened…
Here’s a 3-month chart of the S&P 500. I added the two horizontal red lines to clarify how the index started moving sideways in mid-December, after a big rally.
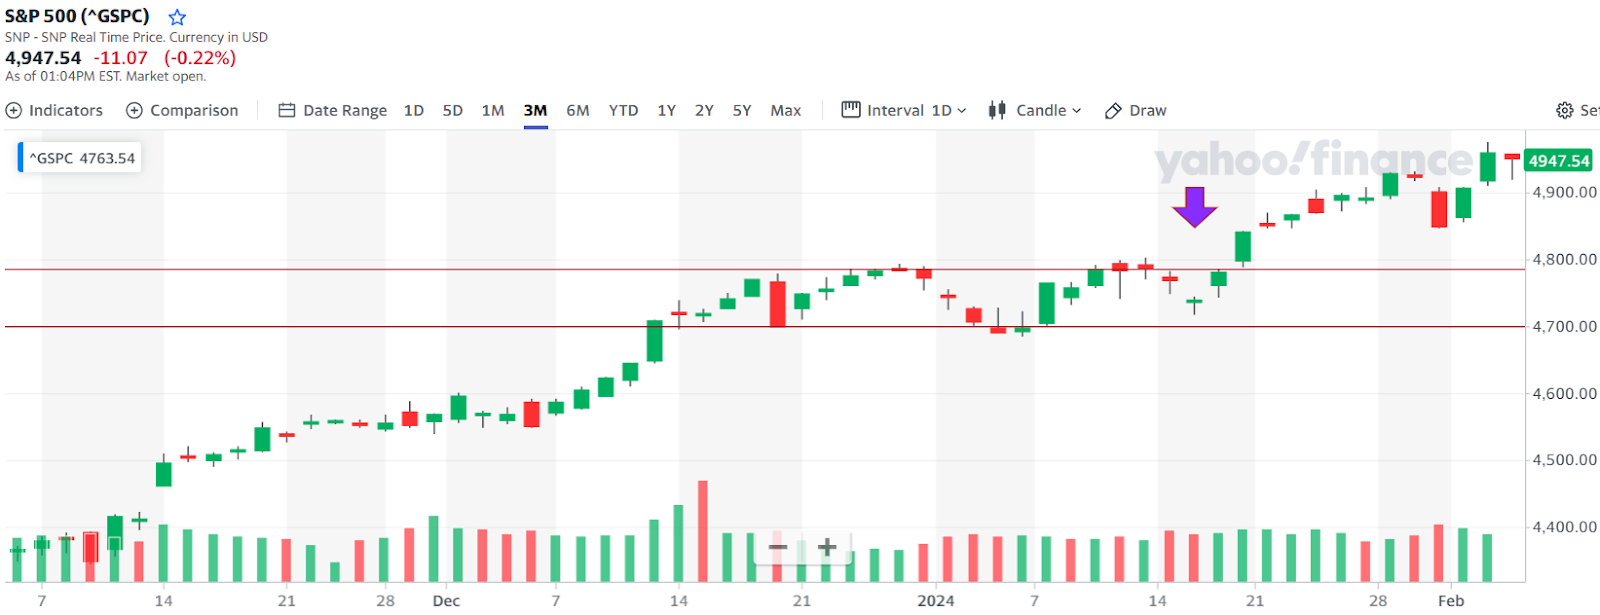
I also added that big purple arrow to point out where the exact day the S&P 500 took off on its last run higher…
Guess what day that was? It’s actually January 17, not the 15th. This AI program missed by 2 days. Still, that information was pretty useful. Because this program does the same for stocks…
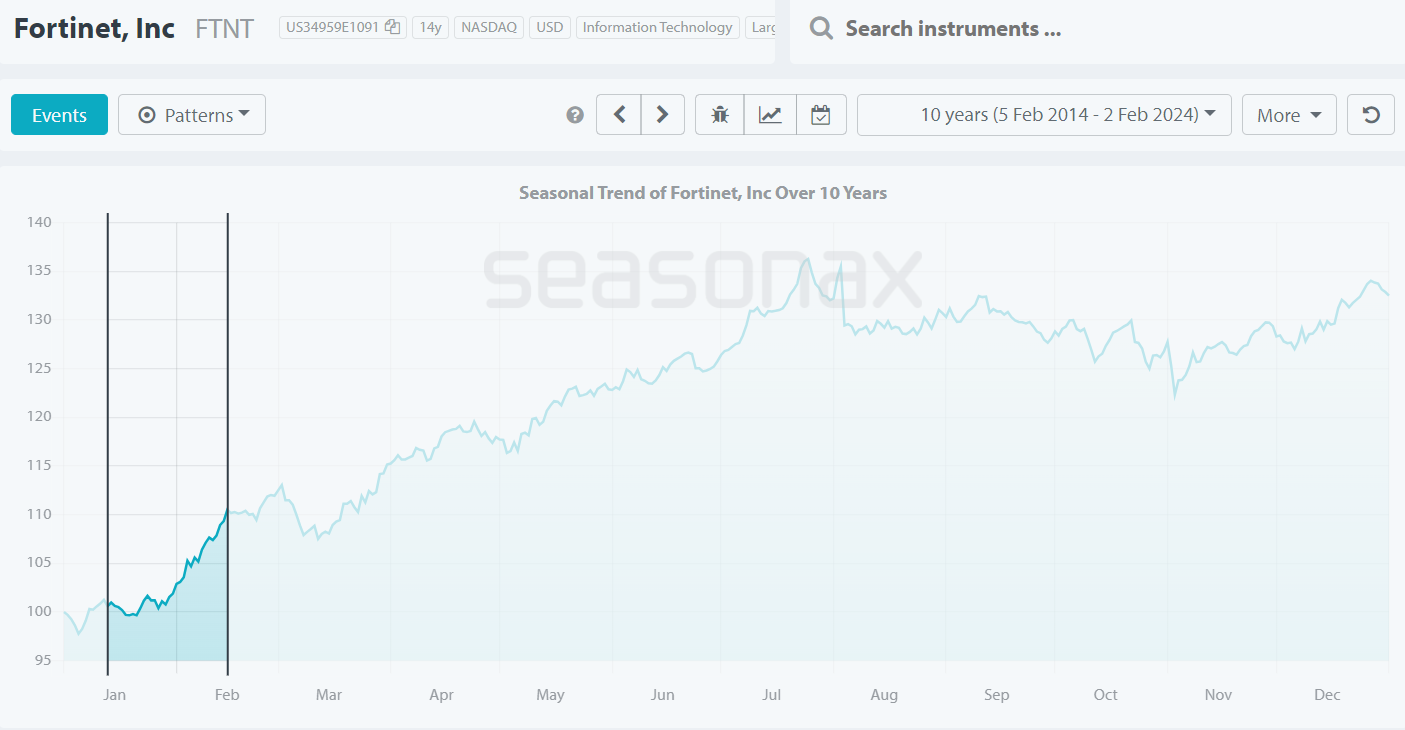
And one of the top-rated stocks for this period (Jan 15 – Feb 15) was a cybersecurity stock named Fortinet (NASDAQ: FTNT).
Here’s how the AI program charted the stock for that timeframe:
And here’s what the statistics said:
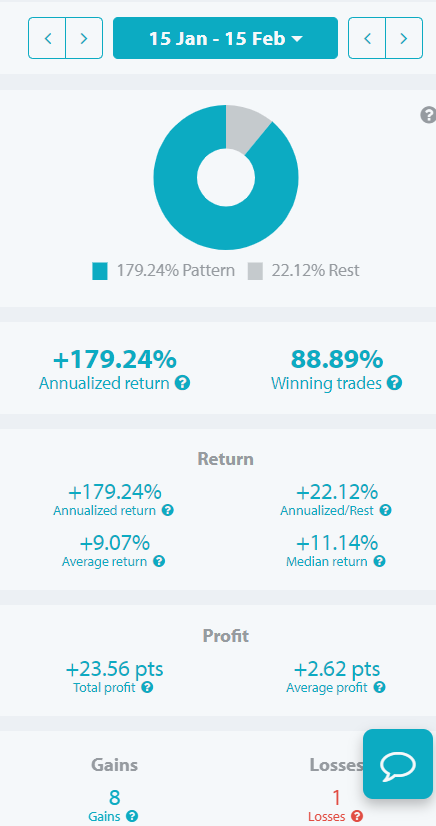
Fortinet was given an 88.89% chance of rallying between January 15 and February 15. And the average expected gain was 9.07%.
Now, I was watching the stock before this rally was “scheduled” to begin. And so on January 10 when it started moving, I alerted a group of traders that I work with that it was time to buy the stock and/or call options on the stock…
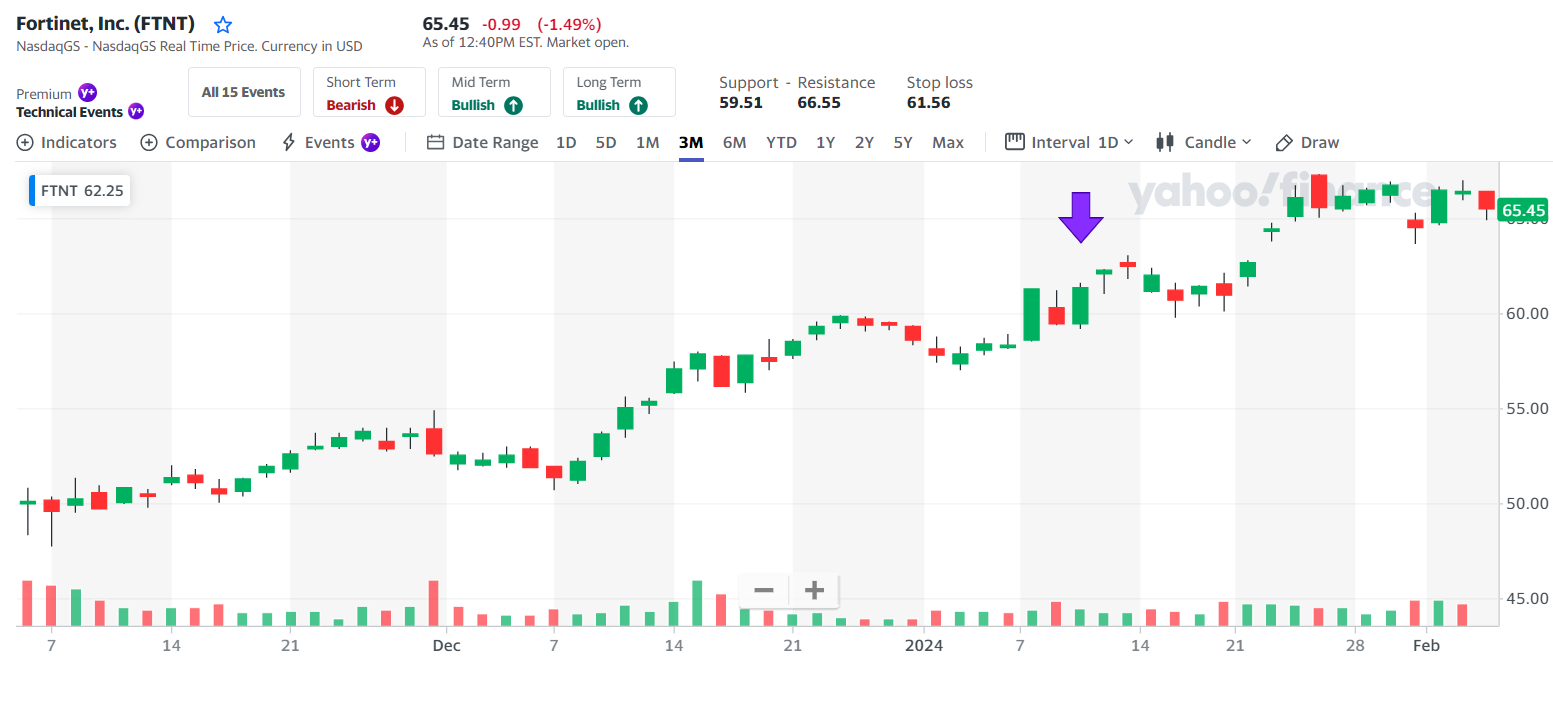
This is the three month chart for Fortinet. That purple arrow is January 10, the day we bought it at $61.25.
We took our profits this morning, with the stock at $66.19. That’s an 8% move (a little shy of the 9.07% gain that the AI program forecasted). The call option trade was worth 65.5%.
Now you may notice that I decided not to stick around until February 15, like the AI program advised. The reason is twofold…
One, I’ve used this program to power winning trades long enough to learn that it is not always accurate to the specific day. History doesn’t repeat exactly, but it does rhyme.
The second reason is what’s coming next…
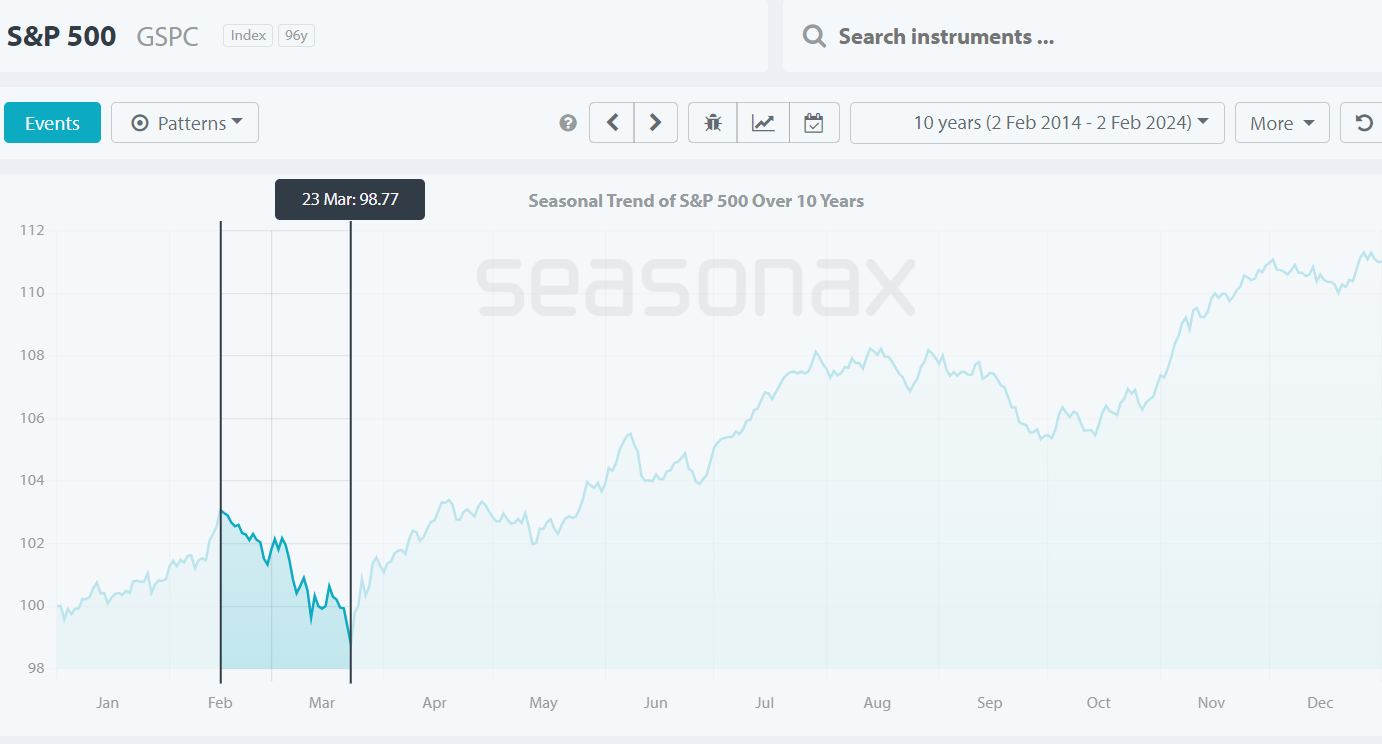
That’s a look at February 15 through March 23. Looks nasty, and the stats back that up:
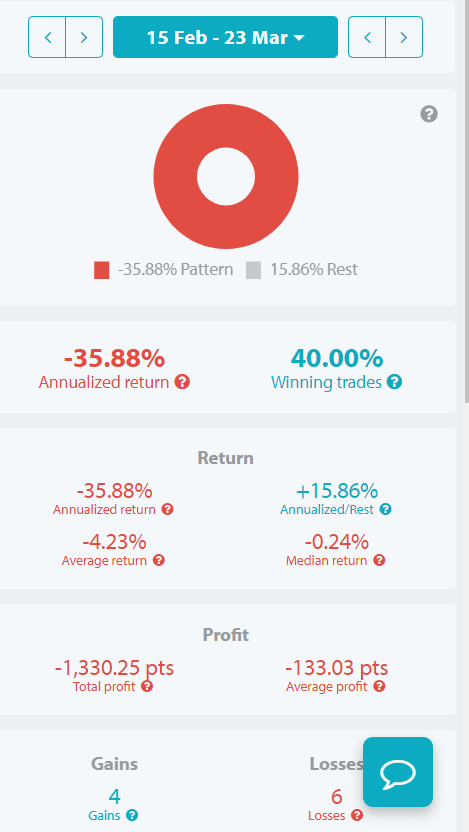
The stats say there’s a 60% chance that the S&P 500 will move 4.23% lower, starting next Thursday. Now, 4.2%, that’s 212 points from current levels. Such a move would take the S&P 500 right back to where it was on…January 17, when this rally started.
And frankly, it looks like this move lower may have started, even though it’s a little ahead of schedule.
Forewarned is forearmed. For more information, you can click HERE.
That’s it for me today, take care and I’ll talk to you Wednesday,
Briton Ryle
Chief Investment Strategist
Pro Trader Today
brit.ryle@protradertoday.com.
Facebook: https://www.facebook.com/ProTraderToday.
X/Twitter: https://twitter.com/BritonRyle
P.S. – Back in November/ December this same AI program triggered two different trades on Bank of America (NYSE: BAC) that led to 40% and 36% profits in less than 10 days…
An 89% profit on Micron Tech (NYSE: MU) in a week…
A 77% overnight gain with Zebra Tech (NASDAQ: ZBRA), and another 50% on Zebra that took about a week…
There was a 62% profit from General Electric (NYSE: GE) that took 6 days…
And 16% profit from Western Digital (NYSE: WDC) over a 7 day span…
It wasn’t perfect, there was a 5.5% loss on Enphase (NASDAQ: ENPH) and a 32% loss on Loews (NYSE: L).
So – that’s a 78% win rate, and a 37% average gain, including the losers…that’s powerful.
If you’re ready to let this AI Trading Agent power your trading profits, or if you’re just curious and want some information, check out this presentation…
Array