How's Business in Texas?
Well. That beatdown last week sucked. When the S&P 500 opened below its 200-day Moving Average (MA) last Wednesday, the selling kicked into overdrive.
Now, we’ve talked plenty about the trading machines – the computer-based trading algorithms that dominate the daily trading action for the stock market. Better than 70% of all stock trading on the New York Stock Exchange is done by the trading machines. And we’ve talked about how these algorithm are dispassionate soldiers to their programmed directives…
The machines get their marching orders, and they march.
Of course the programs are very sophisticated, thousands of man hours has gone into their making. Still, these programs will react to very simple market signals, like, oh I don’t know, the S&P 500 breaking below its 200-day moving average…
My updated 6-month chart for the S&P 500 shows the action, with last week highlighted in the purple oval:
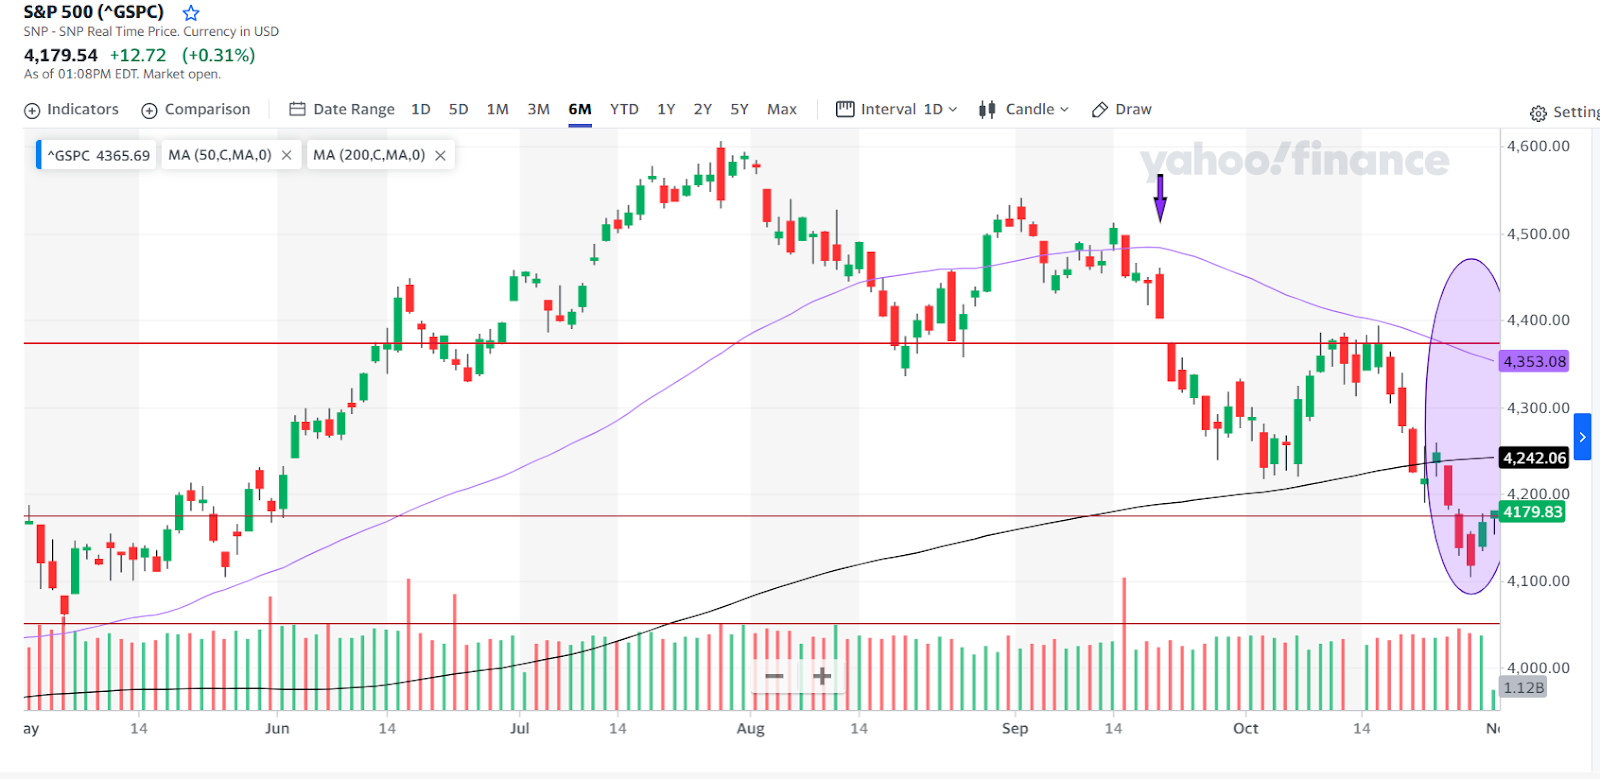
To get our bearings on this chart, I’ve drawn three horizontal support/resistance lines (in red) that have been in play for most of this year. There’s the 50-day moving average (purple line), the 200-day moving average (black line) and a handy little purple arrow that indicates the last Fed meeting, which was kinda the starting point for this whole mess…
Couple things to note: notice the beginning of October, the S&P 500 hit that upper red support/resistance line, and the 50-day MA just above it.
Price action tends to pause when it hits an obvious resistance point. Think of it like a decision point, the next move is yet to be decided. So the machines will back off a little, to see what the next signal is.
Of course, that pause at resistance coincides with the outbreak of war in the Middle East. And I can almost imagine the machines pausing at that resistance point (because it’s an obvious spot on the chart) and then waiting a few days while the programmers added “Israel-Hamas War” to the trading machine code, and then BAM!, they sell it straight down to the 200-day moving average, pause briefly and seek out the next support level, the red support/resistance line at 4,175…
In any event, the negative waves have a NASDAQ and especially chip stocks getting massacred today. And the S&P 500 is right back to the support zone at 4,175 that we looked at on Monday. Fail here and 4,050 is in play.
Well, support at 4,175 didn’t hold, the S&P 500 plunged all the way to 4,103 on Friday. And I gotta say that doesn’t really count as a test of the lower support/resistance line at 4,050.
Inquiring Minds Want to Know
So where does THAT leave us? Is there another shoe to drop that will take the S&P 500 all the way down to 4,050 – another ~125 point plunge? Or does the October sell-off satisfy the machines apparent need to piss off human investors and traders?
I really, really wish I knew…
And I gotta, I don’t really feel confident that there isn’t another leg lower coming soon…
I mean, the Fed makes its latest thoughts on interest rates and inflation known tomorrow afternoon. Is there any reason to think that the Fed is going to change the basic gist of its statement? With the gist of being “we’re watching the data, we will act if the data warrants, we expect rates to to remain at current levels well into next year…”
And more importantly, is there any reason to think that the trading machines will react differently if the Fed’s outlook remains the same?
I’m not sure there is.
Earnings have been good so far. AMD (NYSE: AMD) reports after the bell, could be significant. Investors haven’t responded well to any chip companies earnings, even though Taiwan Semi (NYSE: TSM) said semiconductor demand was stabilizing and Samusng said memory chip prices bottomed a couple months ago. AMD could really help sentiment with a positive outlook. Of course, a negative forecast from AMD would make things worse.
And of course, Apple (NASDAQ: AAPL) reports on Thursday. Word is that Apple is losing iPhone sales in China to Huawei…
Texas Manufacturing Outlook Survey
Yesterday, the Dallas Federal Reserve Bank released the Texas Manufacturing Survey. My dad was born in Texas, and he would have called the surveys results “fair to middlin’.”
There were a lot of mixed signals. For instance there was good news, like “The raw materials prices index dropped 11 points to 13.6, a reading well below average.” But also negatives, like “The new orders index remained negative and slipped four points to -8.8.”
But the comments section, yeesh. I saw a Bloomberg note this morning calling attention to the profoundly negative comments of business activity in Texas, and yep, not sounding real good.
Here’s the link so you can read all of them of you want something to feel depressed about https://www.dallasfed.org/research/surveys/tmos/2023/2310#tab-comments
I’ll share the section on Machinery Manufacturing:
- Business has slowed down significantly; we see no signs of improvement in business activity.
- Six months from now is actually quite scary. The economy is uncertain, and customers cannot predict with any certainty what they see. Political pressure and the wars are now forcing customers to reevaluate their business activities and reduce their outlook. It’s very uncertain.
- Oh, how we long for the days of a stable market. We just lost another long-time customer to China where the pricing for the finished product was what we pay for the raw material. With the inflation we have being imposed on us here in the U.S., we won’t ever see those customers come back.
- We are off by 20 percent this year so far. I don’t expect it to get better. Prices of goods are going up. Shipping is going up.
Remember, these are anonymous comments with anecdotal value. Still, it doesn’t sound great.
That’s it for me today, take care and I’ll talk to you Wednesday…
Briton Ryle
Chief Investment Strategist
Pro Trader Today
brit.ryle@protradertoday.com
Facebook: https://www.facebook.com/ProTraderToday
Twitter: https://twitter.com/BritonRyle