The Everything Rally
On Friday, we talked a little about what to expect from stocks for the rest of the year, and into January. I’m gonna reprint most of it so I don’t have to repeat anything:
The S&P 500 is consolidating that November rally just below new yearly highs. That’s a pretty strong showing, because it’s totally reasonable to think you’d get some profit-taking after that blowout November rally. And I’m sure investors and traders have taken money off the table. BUT – new money has replaced it, and so we have a sideways move for December…so far…
Of course, despite the relative strength the S&P 500 has shown, there is downside risk. There always is…
But frankly, I don’t think it’s significant at this point. The 50-day moving average currently sits at 4,386, almost exactly 200 points (0.5%) below current levels.
The circle I drew shows the breakaway gap that propelled the S&P 500 to where it currently trades.
If the market were logical, the S&P 500 would fill that gap, test support at the 50-day moving average and be met with a horde of buyers who missed the November rally.
But of course, the market doesn’t care about logic…
It’s been said that it’s the market job to frustrate as many investors/traders as possible. And a sideways move like we’ve gotten pretty much frustrates everyone – the bulls aren’t getting any upside and the bears aren’t getting any downside. It’s perfect!
Now, the all-time high for the S&P 500 was set on January 3, 2022, at 4,796. For context, January 2022 was the month when the CPI spiked to 7.5% and it became clear that the Fed’s “transitory” inflation was baloney and interest rates needed to go significantly higher…
Two years later, here we are – a couple hundred points from all-time highs on the S&P 500.
Yes, there remains downside risk into next week. But the next significant move for the S&P 500 is likely to be a run at those all-time highs.
Now, to be clear, when I say “…a run at those all time highs.” I’m talking about 4,796 on the S&P 500. From current levels just above 4,600, it would take right around 200 points to get the S&P 500 to its all time highs…
Doesn’t seem like an outrageous prediction…
Big(ger) Picture
We also looked at my 3-month chart of the S&P 500, but today I want to take a little longer view. So here’s the full 1-year chart:
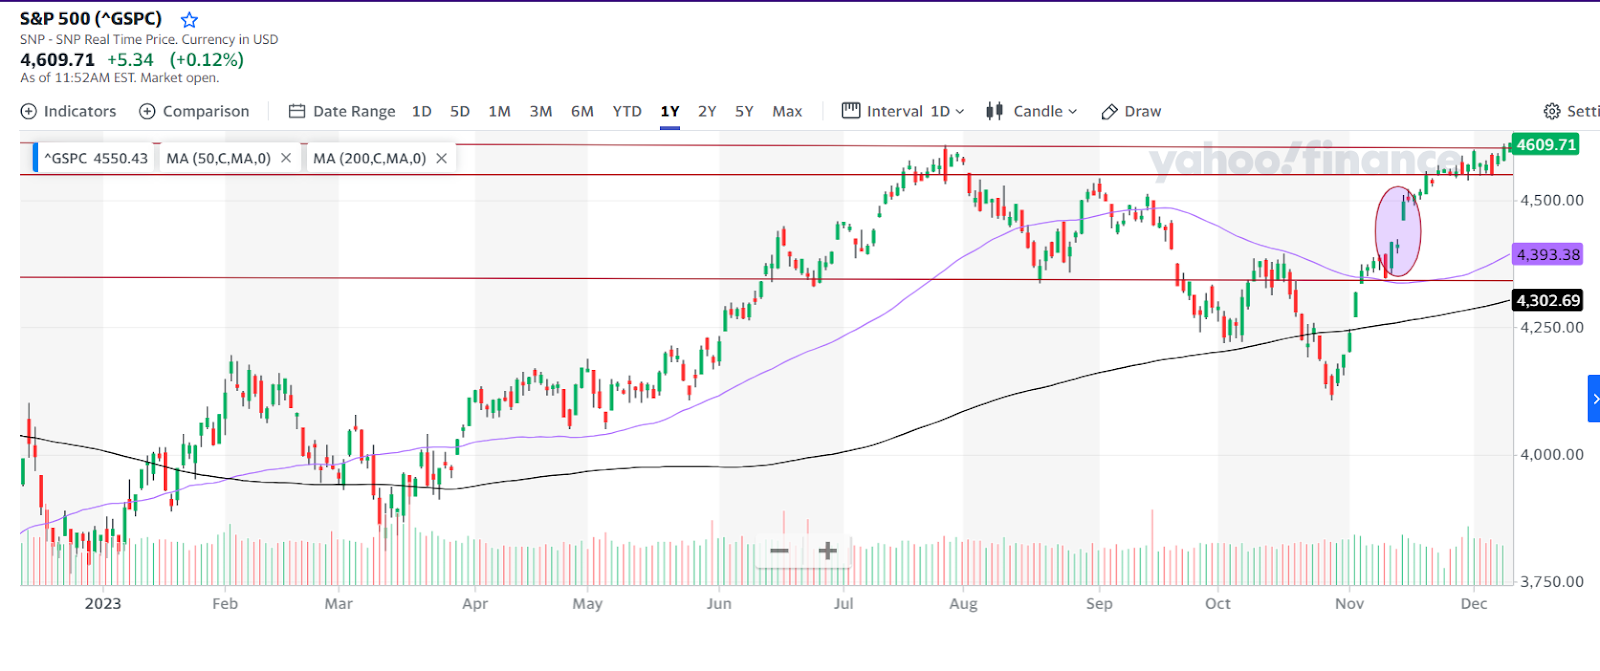
If you’ve seen my charts before, you know the drill. The rising black line is the 200-day moving average (MA) which tracks the long-term trend. The purple line is the 50-day MA that tracks the medium-term trend. And you can see how the index responds to the 50-day MA on this chart, which can be helpful for swing trading.
The horizontal red lines are significant support/resistance points. And the purple oval points out a semi-troubling gap that the index will have to deal with at some point in the future…
For my purpose, it is the upper support and resistance lines that are of interest. Specifically, the S&P 500 spent 13 trading days in the narrow channel between those upper lines. And today, the S&P 500 is breaking higher, out of that channel.
Now, yes, I’m writing this around 12:30 pm ET. And the S&P 500 is only 1 point higher than those July highs – so I’ll try and contain my excitement! But seriously, with the latest CPI inflation reading coming tomorrow, and the last Fed policy statement coming Wednesday, the bullish bias seems significant…
More significant is that the November rally wasn’t just a Big Tech rally. It’s been called an “everything rally” and that’s fitting. Small caps, banks, retail, bitcoin, bonds, gold – it’s all rallied. And I’m here to tell you that will continue during this next leg higher.
What About Oil Stocks?
Good question. Oil stocks have been completely left out of the everything rally. And you gotta wonder if there’s upside for oil prices and oil stocks. Because as we’ve discussed, Saudi Arabia has lost the power to push other OPEC+ nations into production cuts, there’s no doubt Russia is not meeting the cuts it promised and the U.S. is now producing at record highs – over 13 million barrels a day.
In other words, the market seems well-supplied…
There’s no doubt Saudi Arabia isn’t happy about this. And I can’t help but wonder if they’re about to throw another tantrum like they did back in 2014.
If you don’t recall, oil was trading around $100 back then. U.S. production was surging and the Saudis decided to make a power play on the oil market. They boosted their production levels as high as they would go in order to crush oil prices and U.S. oil companies.
Yes, it crushed prices and drove some marginal U.S. producers out of business. But it also made U.S. oil companies much more competitive. And it was very expensive to Saudi Arabia.
Would it be a surprise if Saudi Arabia tried it again? I don’t know, but Russia wouldn’t like it, that’s for sure.
In any event, I’m not sure I see much reason to take on the risk of oil stocks right now. There are plenty of other stocks that have upside. Here’s a link for the stocks I’ve recommended to Pro Trader Today readers over the last year if you want some ideas…
Briton Ryle
Chief Investment Strategist
Pro Trader Today
brit.ryle@protradertoday.com
Facebook: https://www.facebook.com/ProTraderToday
X/Twitter: https://twitter.com/BritonRyle