The Rearview Mirror
There’s no point in trying to hide the fact. You’ve seen the charts I post from time to time. And you’ve read my thoughts on moving averages and support/resistance levels.
And of course, who can forget the trend lines, arrows and circles I’ve artfully added to charts to point out events of interest.
Technical analysis should be a part of every investors process. It doesn’t have to be overly complicated — mine certainly isn’t. But the whole point of technical analysis is to have a way of illustrating buying and selling behavior. Get a feel for price levels at which people buy or sell a stock, and that will be helpful.
Like, I’m a big fan of buying stocks as they break above their 50-day moving average. There’s no guarantees, but you can often catch powerful rallies as a stock moves off the 50-day MA.
For example, the recent massive run for Rivian (NASDAQ: RIVN) started with the stock establishing support at the 50-day moving average, starting on May 10…
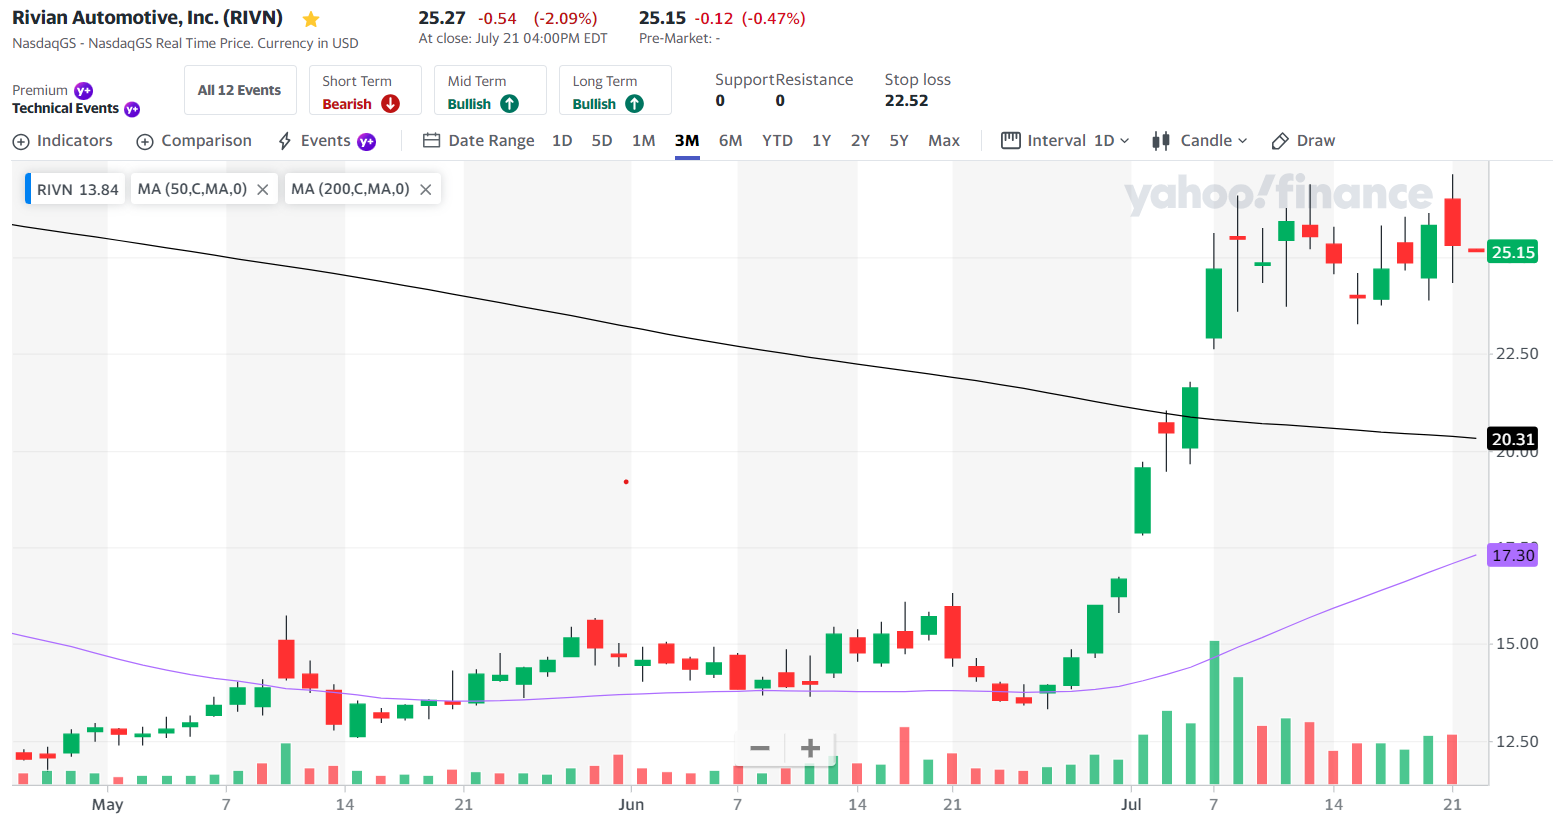
Now obviously, Rivian’s first break over the 50-day MA (purple line) didn’t stick – though it would’ve gotten you in at ~$15 which worked out pretty well after the stock rocketed off that level in early June. And on May 10, I reiterated my earlier recommendation of Rivian, so that’s a win.
A 6-month chart of Schrodinger (NASDAQ: SDGR) is an even cleaner example of the 50-day MAs significance:
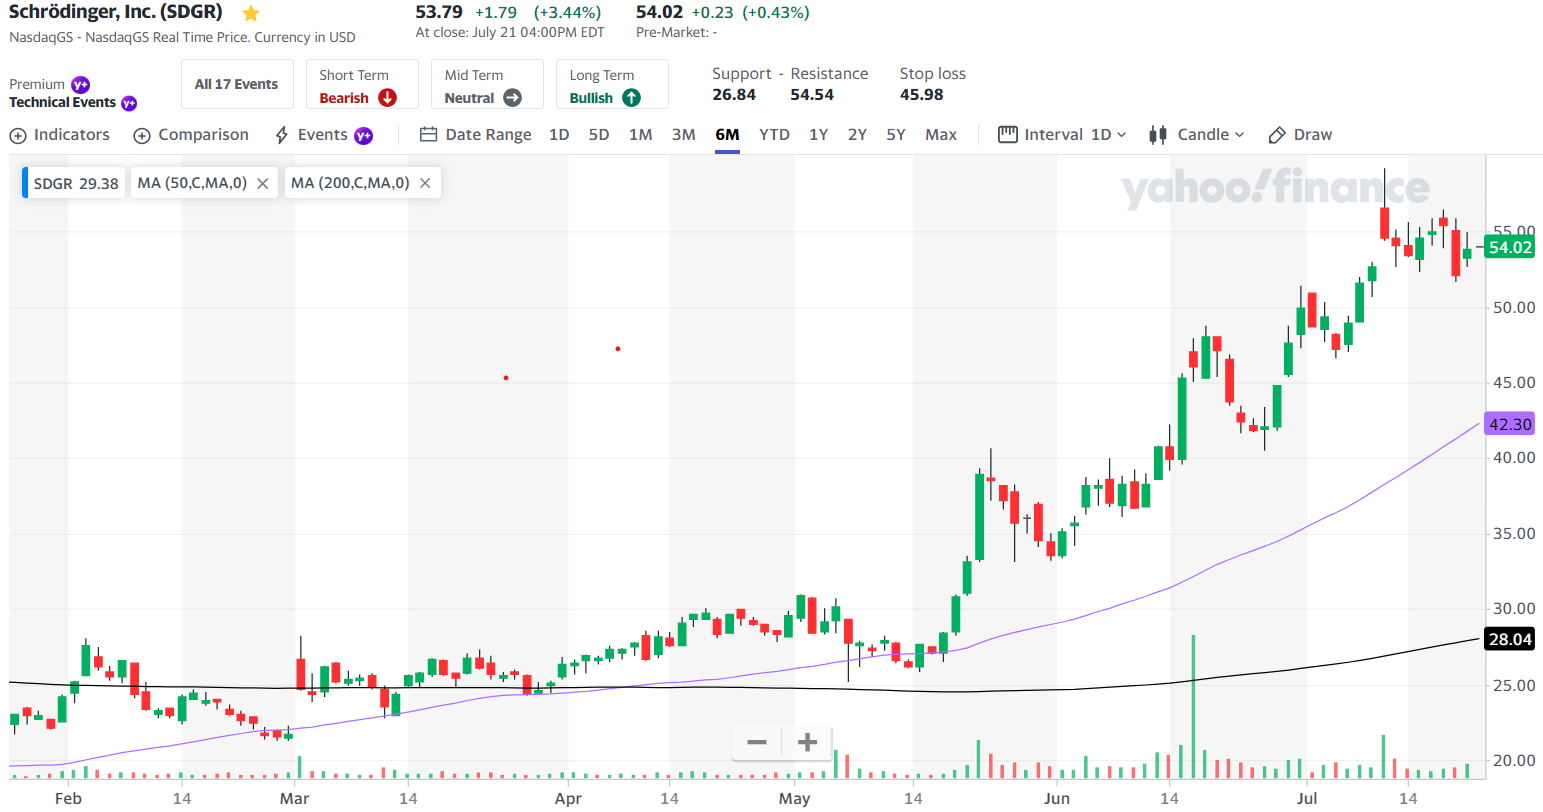
I was doing my due diligence on Schrodinger late March/early April. But when the stock supported right on the 50-day MA in late March, and then started moving higher off it, I pulled the trigger and released my recommendation to Pro Trader Today readers on April 3.
Schrodinger closed at $26.41 that day. It made its final test of that 50-day MA in mid-May, and then blasted higher.
Keeping it Simple
If you’ve read me for a while, you know I like to keep technical analysis simple. And I know there are plenty of traders out there that enjoy a lot of success by relying more heavily on technical analysis than I do. Some will tell you that they ignore the newsflow and fundamental analysis completely and let TA signals call the shots.
Personally, I can’t do that. I need to have a feel for investor sentiment. And more importantly, I can’t imagine punching in a ticker symbol for a trade on a company I know nothing about. I can’t act without some degree of confidence that a particular company’s business will benefit from broader macro and economic trends…
And I definitely can’t act without digging into a company’s earnings potential. Because, in my not so humble opinion, technical analysis won’t help much if the underlying company doesn’t have a clear path to growing revenue and profits.
Earnings are the lifeblood of the stock market. It was improving earnings outlook that drove the breaks over the 50-day MA for both Rivian and Schrodinger.
The earnings outlook was what led me to dismiss defense stocks last week, even though the “macro” picture – a depleted U.S. military arsenal – seemed like it should be bullish for defense stocks. And I will point to the reaction to Lockheed Martin’s (NYSE: LMT) earnings last Tuesday as vindication.
I will also say that it is an improving outlook for earnings in general that has been driving stocks higher all year and especially over the last couple of months. And as I pointed out at the time, it was Nvidia’s historical earnings beat back on May 24 that really kicked improving earnings expectations into overdrive.
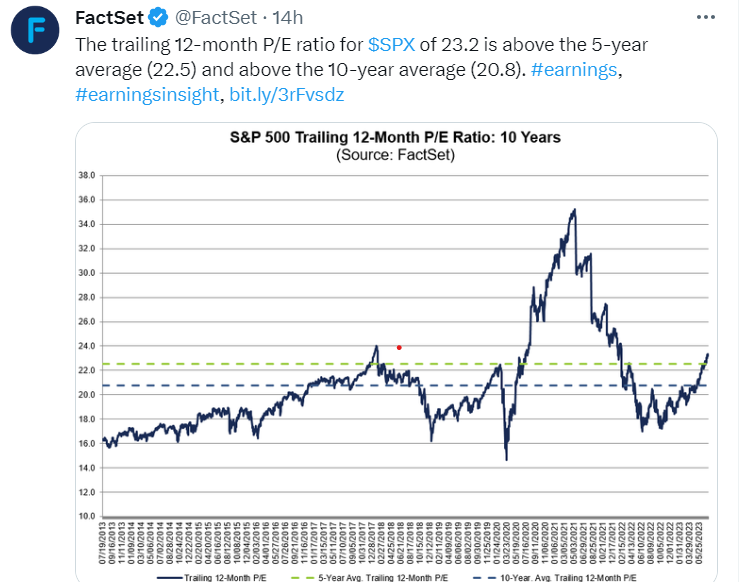
And so I was a little mystified by this chart I copied from the good people at FactSet over the weekend…
Earnings in the Rearview Mirror
Before I start my hatchet job on this chart, I want you to know that I love FactSet research. They do the best earnings-related research I’ve found…
That said, this chart, which seems to be saying that the stock market valuation is stretched, is not helpful. And I am required by personal rules of conduct to post the following meme:
Bottom line: earnings for the S&P 500 over the last year are irrelevant. They are a look in the rearview mirror. They tell us where we’ve been. They do not tell us very much about where we are going.
We’ll be much better off with a chart like this one, from Bloomberg:
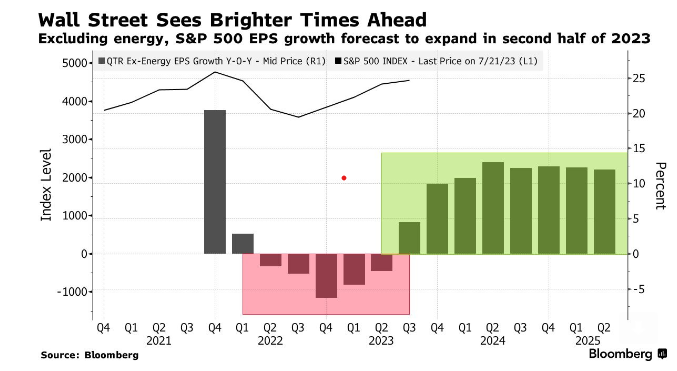
Notice that 2Q earnings, which are being reported now, are expected to be lower than they were last year. Well, a couple months ago, analysts thought it would be a lot worse. 2Q earnings estimates were expected to fall by a bit over 7% lower than they were last year. Now, Q2 earnings (excluding energy) are only expected to be down around 3%.
And looking ahead to the current third quarter earnings (which will get reported in mid-October), analysts now say we’ll see earnings growth approaching 5%. Just a couple months ago, 3Q earnings were expected to be flat year over year.
This is a big change. And it is consistent with the 50-day moving average breaks we’ve been seeing. The picture for earnings to come has been improving – and investors saw it coming because they weren’t staring in the rearview mirror.
Now, to give FactSet some credit, here are a couple blurbs from their latest analysis on Q2 earnings that you may find helpful:
Overall, 18% of the companies in the S&P 500 have reported actual results for Q2 2023 to date. Of these companies, 75% have reported actual EPS above estimates, which is below the 5-year average of 77% but above the 10-year average of 73%. In aggregate, companies are reporting earnings that are 6.4% above estimates, which is below the 5-year average of 8.4% but equal to the 10-year average of 6.4%.
And:
Six of the eleven [S&P 500] sectors are reporting year-over-year earnings growth, led by the Consumer Discretionary and Communication Services sectors. On the other hand, five sectors are reporting (or are expected to report) a year-over-year decline in earnings, led by the Energy, Materials, and Health Care sectors.
Ok, there you have it. That’s it for me today. My brother and his family just got to town before we all head off for a beach week, and I’m taking my nephew to the golf course this afternoon. So take care, and I’ll talk to you Wednesday.
Briton Ryle
Chief Investment Strategist
Pro Trader Today
brit.ryle@protradertoday.com
Facebook: https://www.facebook.com/ProTraderToday
Twitter: https://twitter.com/BritonRyle