What Did the Fed Just Do?
Ok, so, I know I owe you “Part 2” of Tuesday’s article “China…Again?!?” I apologize for leaving you hanging on that, and I will send the second half to you tomorrow…
But I felt it was important to address yesterday’s Fed meeting and what it means for the market going forward, and for your investments.
Now as you know, the Fed didn’t hike interest rates yesterday, which was as expected. Even though the most recent inflation data from the CPI and PPI was slightly higher than expected, it wasn’t enough to change the overall trend for inflation – which has headed lower for months. The Fed’s targets still show inflation continuing to slow to 3% in 2024.
But if you’re seeing the headlines, you’re getting the message that the Fed will still hike rates one more time in 2023. And frankly, this is kind of a strange message for the Fed to send…
12 of the 19 regional Fed governors said they thought there might need to be another hike this year. And this begs an obvious question: why wait? If you think there needs to be another hike, why not just do it and get it over with?
As I see it, there are a couple plausible reasons that the Fed is pausing the rate hikes,, but still saying there will be another hike later this year. The first reason is that the Fed wants to keep the pressure on. Perhaps they’re worried that if they give the “all-clear” signal there’ll be some kind of wild relief rally and spending party that ends up stoking inflation out of its downtrend. Seems unlikely, but what can I say?
The other plausible reason is oil. Oil prices have really moved higher over the last few weeks as Saudi Arabia and Russia pledged to hold production cuts in place for the balance of the year. And of course, higher fuel prices affect every aspect of the U.S. economy…
Shipping costs rise, so the price of shipped goods also rises… People pay more at the pump… Air travel gets more expensive, and so on.
So it’s reasonable to think that if oil prices stay high, inflation will rebound and more rate hikes would be needed.
But that’s really twisted logic. Rate hikes are intended to slow consumer demand. The whole point of rate raising borrowing costs is to force companies to choose between their profit margins and their payrolls. When borrowing costs get high enough to really bite, companies will inevitably choose to start firing people to protect profits and Voila! – consumer demand falls and so do prices.
It sounds harsh, that the Fed’s job is to get people fired, but it’s the truth.
But if we get the point where the Fed hikes rates to punish workers because of higher energy costs due to production cuts that are beyond U.S. control – it just doesn’t make sense. So I’d say there’s a decent chance that the Fed is hoping that oil prices will moderate a little over the next few weeks, thereby easing the inflationary pressure a little.
Strike One, Strike Two…
Of course, there is a third reason that may help explain why the Fed chose to pause its rate hikes – the labor strikes in Hollywood and Detroit. It’s widely believed that if the Autoworkers strike lasts even a month, that’s enough to send the U.S. economy into recession.
It would be bad form for the Fed to hike rates and exacerbate a potentially recessionary event like labor strikes.
Plus, U.S. Congress seems to be steering us toward a government shutdown in a couple weeks. That’s another event that could weigh on growth.
The bottom line is that there’s suddenly a lot of uncertainty out there. And we all know the old saying “the market hates uncertainty.”
So of course, stocks are getting whacked.
But let’s take a look at my updated 6- month chart for the S&P 500:
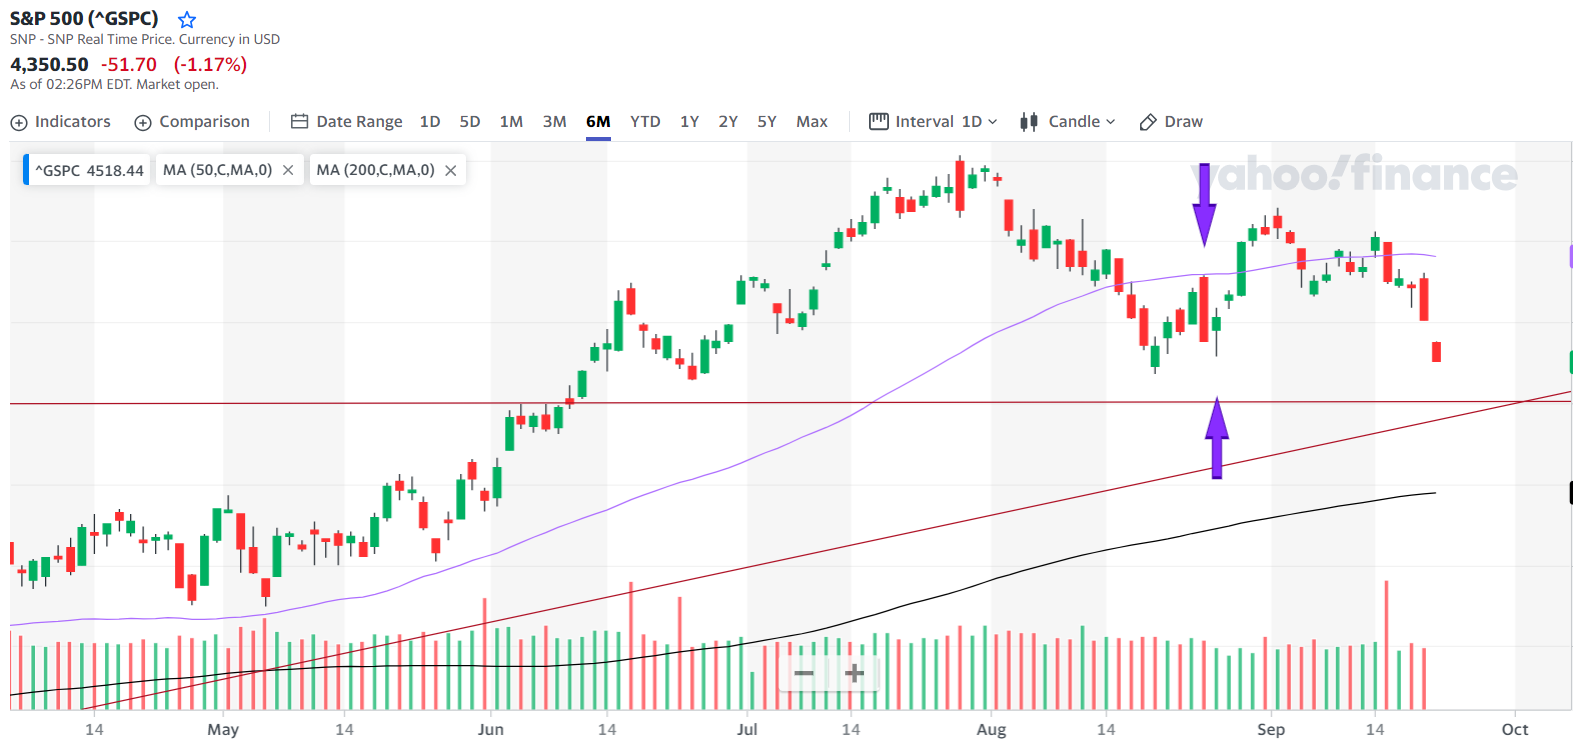
As a refresher, the purple line at the top is the 50-day moving average (MA). The black line at the bottom is the 200-day MA. Notice how the 200-day MA approximates the rising red line. That rising red line is the rising trendline from the October 2022 low.
Also note that the rising red trendline is about to hit the horizontal red line. That horizontal red line sits at 4,300 and marks critical support/resistance at the bull market breakout back on June 8.
Finally, the purple arrows mark the two days surrounding Nvidia’s last earnings report. The first day (big red bar) was when the market gapped higher after Nvidia’s earnings, reversed and plummeted. The second purple arrow is the next day, where the market gapped lower and rallied. That low on that day was 4,356. Today’s low so far is 4,348.
All Eyes on 4,300
4,300 is an important spot on the S&P 500 chart. One more day like today and we’re there. You can see that since the S&P 500 broke over 4,300 (horizontal red line), the index has approached that support point a couple times, but never really tested it. Buyers stepped in both time and took stocks higher.
So…what’s it gonna be this time?
I’ll tell you what I think. I think the next 3-5 days are the time to take advantage of any downside and get positioned for a year end rally.
Forewarned is forearmed.
That’s it for me today, take care and I’ll talk to you on Friday…
Briton Ryle
Chief Investment Strategist
Pro Trader Today
brit.ryle@protradertoday.com
Facebook: https://www.facebook.com/ProTraderToday
Twitter: https://twitter.com/BritonRyle