Why Stocks Are Dropping
It’s kinda common for investors to think that if the U.S. economy is doing well, then the stock market should be doing well, too. After all, better economic growth means people and corporations are spending money, which means rising profits and stock prices, right?
Well, yes and no.
The whole investing game is predicated on seeing the future – identifying the times when economic growth starts to expand, and then zeroing in on the companies that benefit the most.
It’s always all about earnings. One big reason that the stock market had such a good year was that investors realized back in January that the price hikes that companies implemented were not choking off demand – profits were likely to be better than expected.
The biggest threat to that better-than-expected earnings forecast was the Fed. Which is why investors slow-rolled the rally until it was clear that the Fed was nearing the end of its hiking cycle in May-June. Then stocks took off, signaling a new bull market on June 8.
We’re pretty much done with second quarter earnings. And investors’ expectations from January – that at worst, profits wouldn’t be as bad as expected and at best, would be better than expected – has played out pretty well. FacSet tells us that if we could ignore earnings from just 5 companies – Chevron, Exxon, Pfizer, Moderna and Merck – 2Q earnings for the S&P 500 would have grown slightly year over year – a much better result than what analysts were forecasting at the start of 2023.
When it comes to the bad second quarter earnings, they are easy to discount. Pfizer and Moderna were bad, because there hasn’t been a new COVID vax in the market in nearly a year. And lower oil prices during the second quarter definitely weighed on the oil majors. (I don’t know what Merck’s problem is…)
FactSet (which offers up excellent earnings analysis) goes on to tell us that on average companies that have reported better than expected 2Q earnings have been met with selling – 0.5% share price declines in the 4 days surrounding earnings. The 5-year average for better than expected earnings is a share price increase of 1%.
This would be the worst reaction to positive earnings surprises since the second quarter of 2011.
Two obvious questions. One, why are investors bucking the historical trend and selling stocks even when they beat earnings expectations. And two, are there any parallels to 2011 that may be relevant today?
Glad you asked…
History Doesn’t Repeat…But It Does Rhyme
Did you know that August 8, 2011 is sometimes called the Black Monday of 2011? The S&P 500 got crushed for 13% that day. From current levels today, that would be a 570 point drop for the S&P 500, and nearly a 4,500 point drop for the Dow Industrials.
Yikes.
Black Monday 2011 was the exclamation point on a 25% beatdown between Juy 25 and August 8, 2011.
Now, 2011 wasn’t that far removed from the Great Financial Crisis. Investors were still pretty jumpy. Investors were still terrified of banks, and the fear of return to the GFC years was palpable.
2011 was the start of the sovereign debt crisis in Europe, that hit its crescendo with Greece. And on Saturday, August 6, 2011 – two days before 2011s Black Monday – Standard & Poor’s lowered the U.S. credit rating from AAA, where it had stood since 1941, to AA+.
Interesting that Fitch just lowered its rating for U.S. debt to AA+ from AAA on August 2…
Of course, Fitch’s recent downgrade isn’t anywhere near as significant as the one from 2011. The coincidence with 2011 is mostly an FYI kind of thing. But U.S. Treasuries are telling a pretty important story right now, one that suggests why stocks have been selling off even as the economy gets on more stable footing.
Over the last few weeks, Treasury bonds have sold off and yields have risen. The 10-year Treasury bond yield has moved up to 4.3% – it’s highest level since 2007, before the GFC. But that’s still below where the Fed’s interest rate stands – 5.5%.
The reason the 10-year bond yield is lower than the Fed’s interest rate is because investors believe the Fed will cut interest rates long before 10 years goes by.
The reason the yield on the 10-year has spiked higher is because investors are starting to believe it could be a while before the Fed actually does cut interest rates. Still not 10 years for a cut, but maybe longer than was believed a few weeks ago..
Because obviously, the Fed’s entire rate hike campaign has failed to make any significant dent in U.S. economic growth. And if that continues to be the case, if the U.S. economy is capable of solid performance with rates up around 5%-5.5% – like it did for decades before the GFC – then perhaps the Fed will leave rates where they are for longer than investors have been expecting.
And if we play that logic out, it is corporate profits and government spending that will likely suffer. Corporate profits, because higher borrowing costs will eat into the bottom line. And government spending, because higher interest payments will hamper new spending initiatives and may even prompt spending cuts.
The ZIRP Bubble
One of the great stock market debates over the last decade was over the ZIRP stock market bubble. ZIRP refers to the Fed’s Zero Interest Policy that helped underpin the stock market rally ever since the GFC. And if you argued that there was a ZIRP Bubble, you were saying that the ability for companies to borrow at ultra-low cost was distorting corporate profits, making them look much better than they would in a “regular” interest rate environment.
Personally, I never got too worked up about the ZIRP Bubble thing. Because I’ve always found it best to take what the market gives. And if that’s a zero interest rate environment, so be it. Better to make an honest appraisal of the situation and invest accordingly than to tilt at whatever economic policy windmills or investment trends you don’t like.
But the thing is, the only thing corporate finance and Wall Street Investment banks have known for 15 years is a zero interest rate environment. Ask a Gen Z fund manager what 5% rates mean for an AI start up and you’ll get a blank look with a “Wait, what?”
5% rates weren’t part of Silicon Valley Bank’s business model. They literally didn’t know what to do. And scarier still is that the bank’s head regulator, San Francisco Fed governor Mary Daly, didn’t know what to do either. Both of them thought that accounting gimmicks were just as robust as real money. Nope…
So where does that leave us? Well, I think part of the reason that stocks – especially tech stocks – have struggled is because Wall Street Investment banks and institutional investors have been digging around in their vaults and blowing the dust off their 20 year-old manuals for investing in an ABZIRP economy. ABZIRP, as in, Anything But Zero Interest Rate Policy.
I know it’s Friday, and I’m running a bit long. But let’s take a quick look at the S&P 500 chart and get a handle on where things stand…
Fun with Charts
Back on June 23, I told you to Take the Summer Off. The S&P 500 had already hit an intraday high just shy of 4,450 on June 16. And on June 23rd, the S&P 500 hit an intraday high of 4,366.
Yeah, ok, I was a little early. Here’s the updated chart:
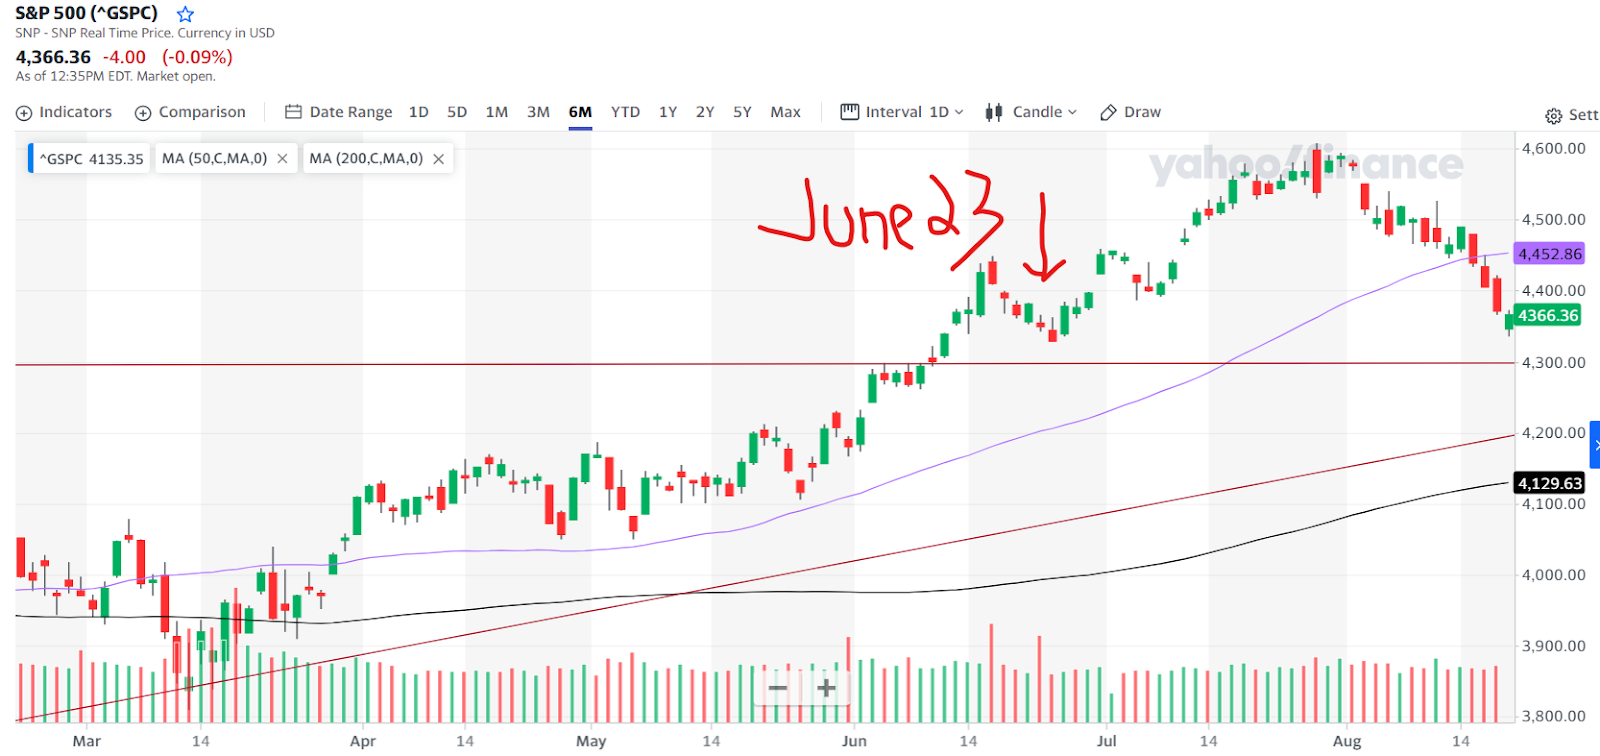
As I write, the S&P 500 is trading at…4,366. Right back to where it was on June 23. Quite the round trip.
Now, about the lines on the chart. The purple line is the 50-day moving average. The S&P 500 broke below that support level early this week, indicating the medium term trend has turned bearish. The black line at the bottom is the 200-day moving average, which denotes the long-term trend line. Notice how it approximates the red trendline just above it. That red line denotes the trend from the October 2022 lows.
Now the horizontal redline marks the support/resistance line created by the bull market breakout that occurred on June 8. It sits right at 4,300.
Back on June 23, I told you I thought the S&P 500 would drop down into the zone between the rising red trendline and the horizontal support/resistance line.
And I still think that’s a pretty likely scenario. Only back on June 23, that red rising trendline was at 4,100. Today it sits around 4,200. And I think that 4,200 is a realistic target for the S&P 500. And if you’re looking to put money to work, that’s the place to do it.
OK, that’s it for me this week. Take care, have a great weekend, and I’ll talk to you Monday.
Briton Ryle
Chief Investment Strategist
Pro Trader Today
brit.ryle@protradertoday.com
Twitter: https://twitter.com/BritonRyle
Array