Dead Cat Bounce
Last week sure was fun. The S&P 500 gapped higher for last Monday’s opening bell and never looked back. By the time the closing bell sounded on Friday afternoon, the S&P 500 had surged nearly 6%.
Amazingly enough, the Fed was actually a bullish catalyst. Whereas at the previous FOMC meeting September 19-20, the Fed’s statement that it was pausing the rate hikes but still may have more work to do to fight inflation unleashed a beating for stocks that pushed the S&P 500 almost 10% lower, it was a different story last week…
After last week’s Fed statement, investors are now convinced that the Fed is done with the rate hikes. Let’s go to the chart and see where things stand…
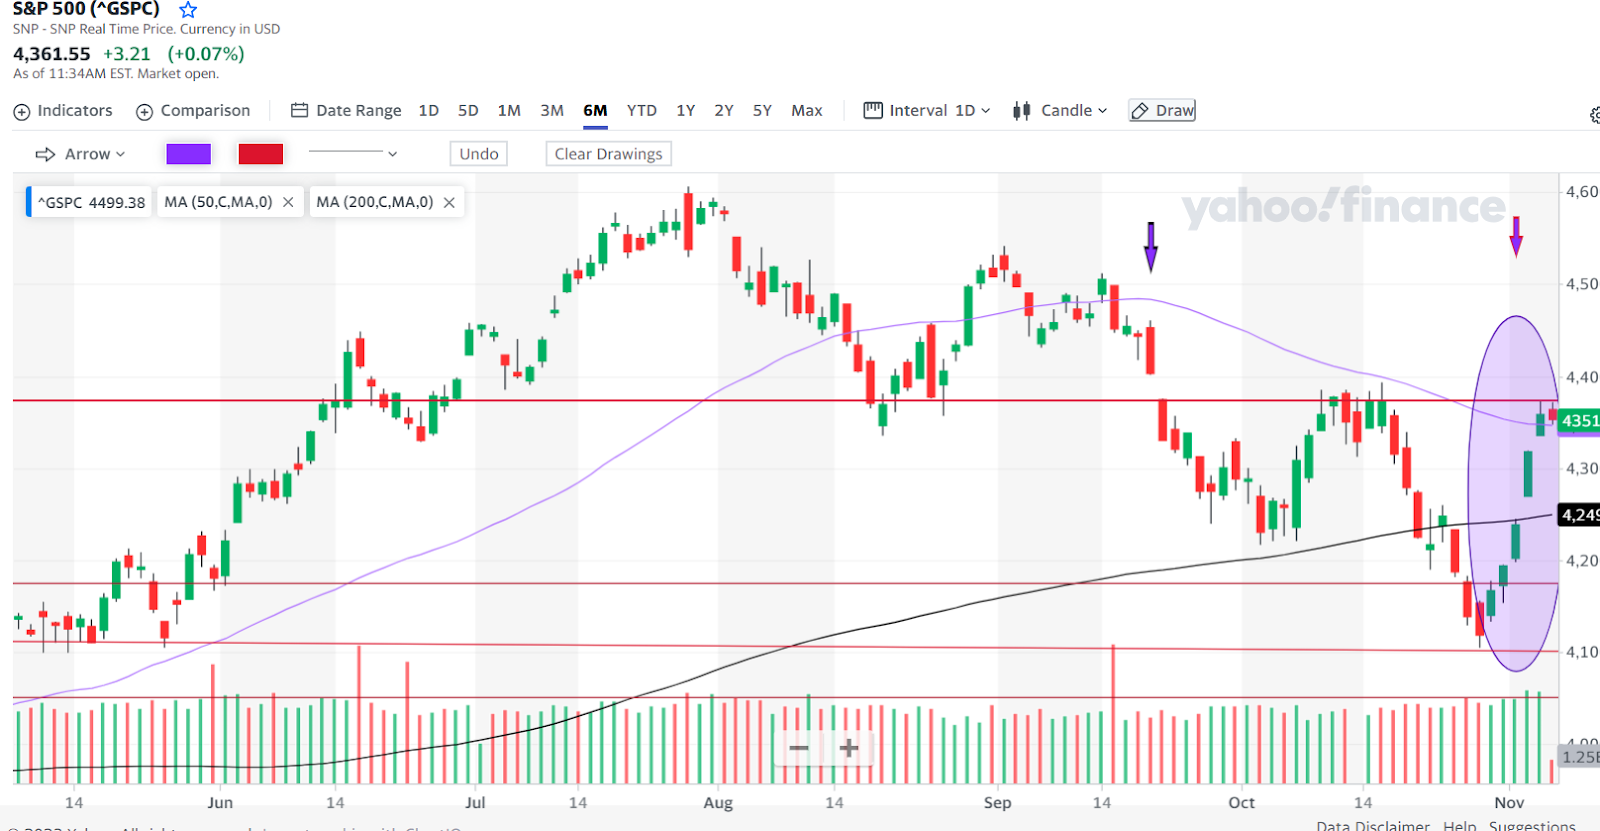
First off, the two purple arrows indicate the last 2 Fed meetings. The first one indicates September 20. The S&P 500 had already dropped blow its medium term trendline, the 50-day moving average (purple line), an early warning for that Fed meeting. Sure enough, the S&P 500 crashed through important support/resistance (top red line) the very next day, and two weeks later, in early October, the S&P 500 was testing the long-term trendline, indicated by the 200-day Moving Average (black line).
The rally attempt off the 200-day moving average was cut short by the Hamas attack on Israel, and the S&P 500 responded by slicing through the 200-day moving average and hitting the support resistance line down at 4,100, created by the May lows.
Now, on October 25, I told you that 4,050 on the S&P 500 might be in play…and the index got pretty darn close.
And if you recall, sentiment was terrible two weeks ago. Everything sucked, plenty of people were out saying that the U.S. might already be in recession.
There’s an old saying that goes “when it’s time to buy, you won’t want to.” And I’d say that about sums up the mood during those last two weeks in October. Of course, there’s no better set up for a rally than extreme bearishness.
And so you know – I do not mean that in any kind of “told you so” way. Just because sentiment is extremely negative and is consistent with past conditions where stocks have put in a bottom should not be seen as a market timing indicator. A lot of people thought the summer of 2008 was a bottom too…
In any event, as you can see on the far left of that chart, the price for the S&P 500 is now pinched between its 50-day moving average and that upper support/resistance line. So what’s next?
Earnings Outlook
Earnings season is mostly over. Bloomberg tells us that it hasn’t been a particularly strong earrings season:
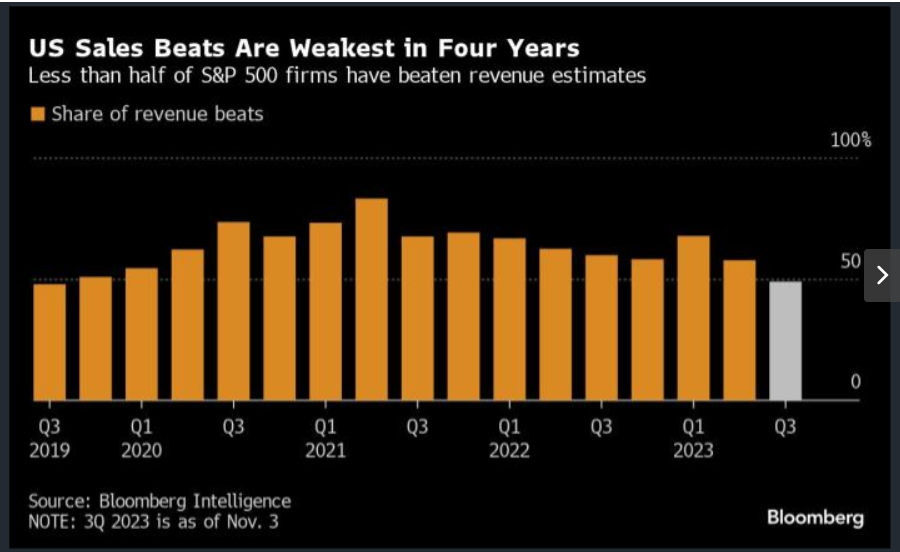
The companies of the S&P 500 are not beating their revenue expectations at a very strong pace.
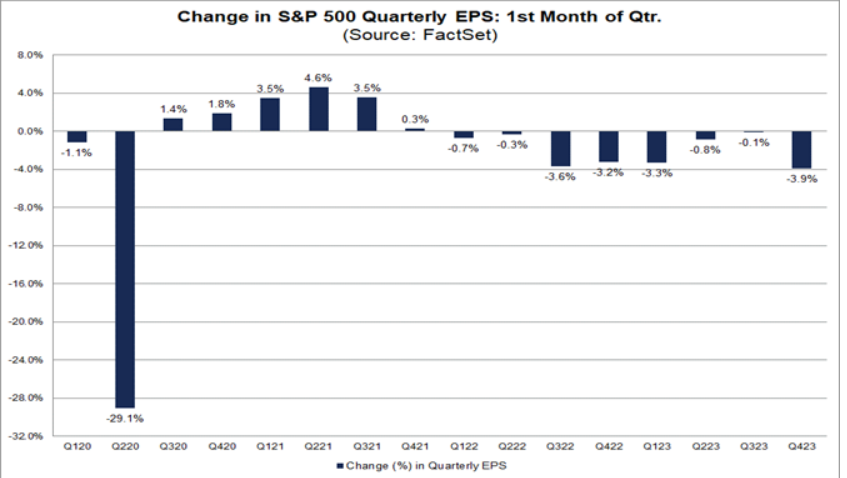
More worrisome is this nugget from the good people at Factset:
Given concerns in the market about a possible economic slowdown or recession, have analysts lowered EPS estimates more than normal for S&P 500 companies for the fourth quarter?
The answer is yes. During the month of October, analysts lowered EPS estimates for the fourth quarter by a larger margin than average. The Q4 bottom-up EPS estimate (which is an aggregation of the median EPS estimates for Q4 for all the companies in the index) decreased by 3.9% (to $55.61 from $57.86) from September 30 to October 31.
You may recall that we talked about how analysts were raising estimates coming into third quarter earnings back on October 9. Here’s a chart from Factset that illustrates the difference:
Now for the big one, also from Factset:
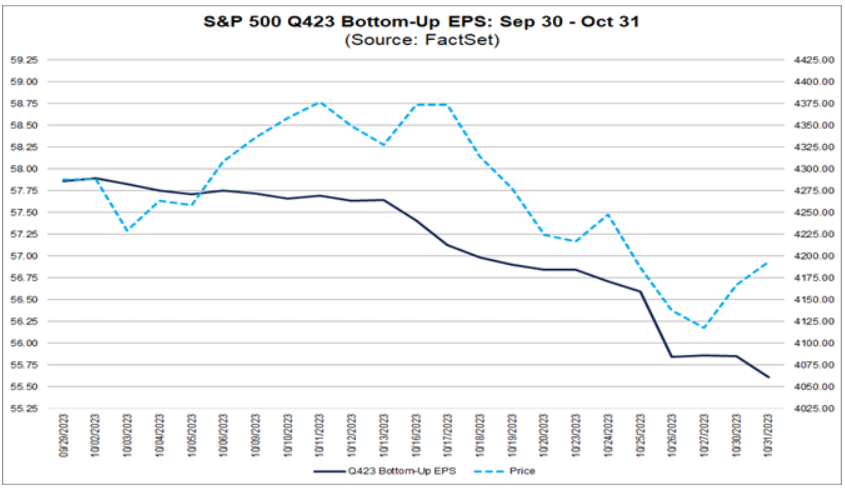
The black line tracks how earnings estimates are going. The blue line shows the price action on the S&P 500 through October 31. Draw this chart today and the blue line is even further departed from earnings estimates.
This chart does not fill me with optimism. In fact, it’s the opposite. The market is not going to sustain a rally while earnings estimates are falling. And the fact that GDP growth estimates for the fourth quarter just got hacked from 2.3% to 1.2% suggests that it will be even harder for companies to grow their earnings.
I hate to say it, cuz I love a good rally, but last week’s move sure looks like a dead cat bounce. Tread carefully…
That’s it for me today, take care and I’ll talk to you on Wednesday.
Briton Ryle
Chief Investment Strategist
Pro Trader Today
brit.ryle@protradertoday.com.
Facebook: https://www.facebook.com/ProTraderToday.
Twitter: https://twitter.com/BritonRyle