Was That a Bottom?
Let’s start this week with a look at the 3-month chart for the S&P 500. I’ve added a couple do-whiggets (as my Dad might’ve said), so we’ve got that to talk about…
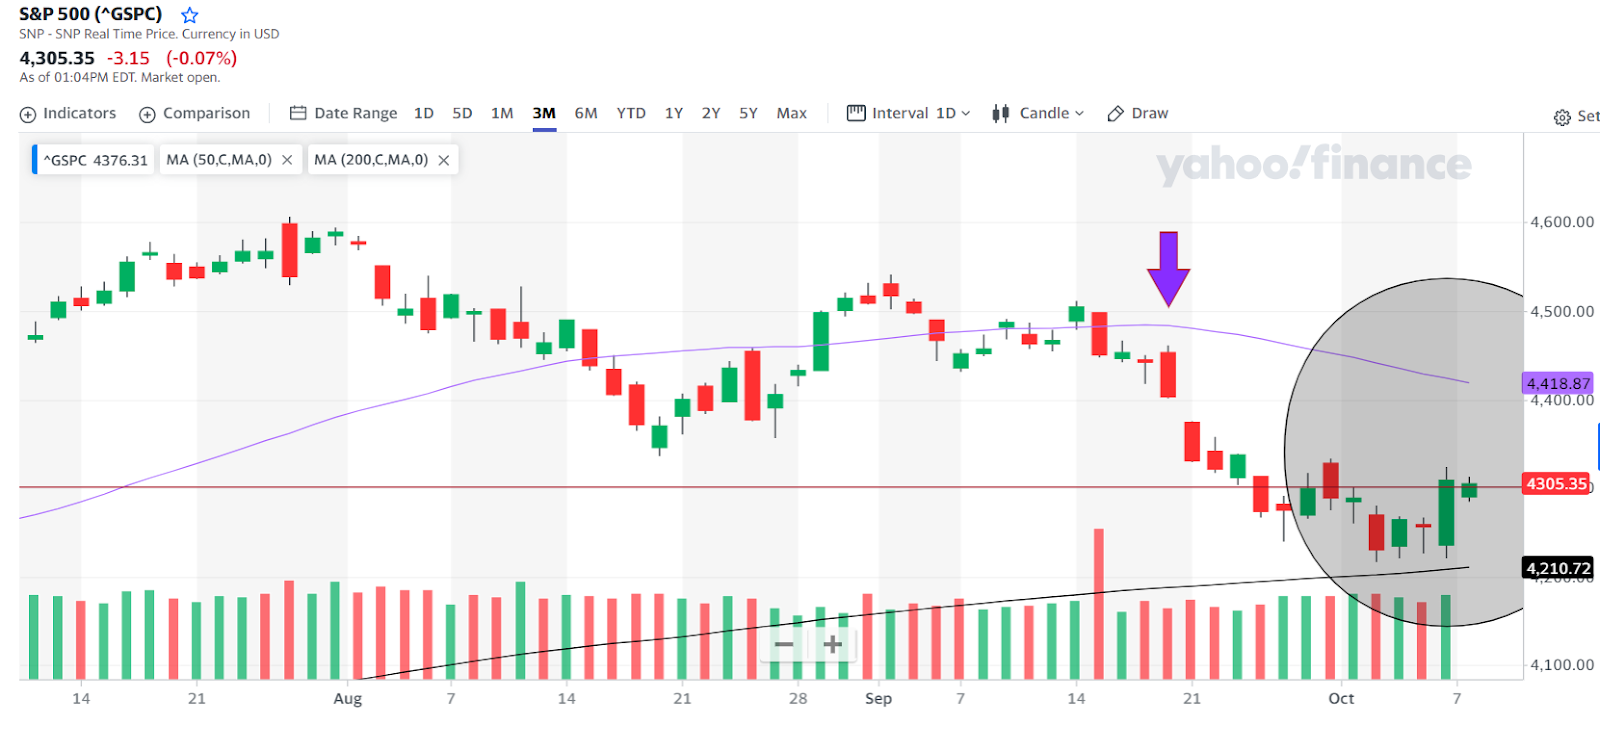
The first do-whiggit is the purple arrow. That’s September 20, the last Fed meeting, also known as the day shit really hit the fan.
The Fe d didn’t hike on September 20. Instead, Chair Powell and his minions said there would probably be more hikes this year and less reason to be optimistic about rate cuts next year. I don’t know which was worse – the plural form of “hikes” for this year or pushing out the timeline for rate cuts next year.
Either way, it wasn’t the happy meal combo the market wanted…
The S&P 500 opened at 4452 on Fed day and closed the next day – Thursday, Sept. 21 at 4330. 120 points in two days is nasty. And it was that post-Fed move that sparked the massive rally for bond yields and all the talk of recession we’ve all enjoyed so much over the last couple of weeks!
Now let’s move into the gray circle. This area coincides with a kind of crescendo for the recession talk last week. You may recall, they were coming out of the woodwork to tell you that recession was dead ahead, if we weren’t already in one.
But notice the glyphs I included in the circle. They represent the S&P 500’s action on Tuesday, Wednesday, Thursday and Friday last week – the penultimate tall green one being Friday. The bottom of each is roughly equidistant from that rising black line.
That black line is the 200-day moving average, sitting at roughly 4200 on the S&P 500.. The 200-day MA is generally accepted as the demarcation of the long-term trendline. If the S&P 500 is above that line, it’s an uptrend. Below it, and the S&P 500 should be expected to trend lower.
The fact that those four consecutive days failed to break below the 200-day MA is a good sign. Buyers stepped in to “support” stock prices before they hit the long-term trendline. An even better sign is that buyers stepped in while bonds prices were getting creamed and recession warnings were hitting a crescendo.
Now I will grant you: Friday was just one day, albeit a good one. Without getting mired in the minutiae of Friday morning’s Non Farm Payroll report, suffice it to say that it was a good enough counterpoint to the Fed’s “more hikes” narrative that the S&P 500 launched all the way back to the 4,300 level (horizontal red line).

Considering I’ve spent most of the time since that September, 20 Fed meeting advising you to use the weakness to buy stocks in anticipation of a year end rally, I gotta say I’m pleased with the market’s action last week. The odds that the S&P 500 put in a bottom last week look pretty, pretty good.
The Wall of Worry
At the risk of sounding like a completely depraved capitalist, when I saw the rockets raining down on Israel over the weekend, the second thing I thought was “great, just what the market needs.”
Dow futures down over 200 points this morning, along with a big spike for oil prices, well, it didn’t look good, exactly.
But as I write, the market has reversed its early losses and is rolling higher. It’s a perfect example of a market climbing the Wall of Worry. Just about every decent reversal starts the same way.
The Fed-day gap from September 20-21 (purple arrow) sts between 4402 and 4374. Filling that gap up to 4402 is the first order of business.
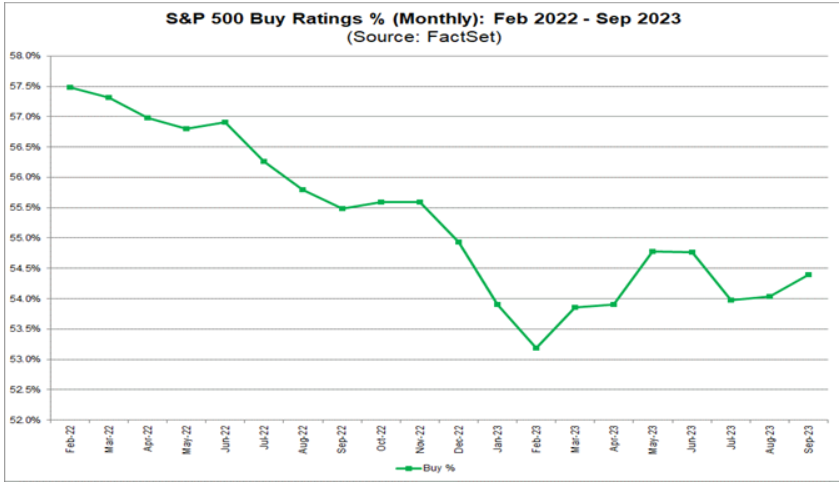
JP Morgan (NYSE: JPM) kicks off third quarter earnings on Friday. I’ve already told you that analysts have been raising earnings expectations ahead of Q3 earnings season:
Normally, analysts start lowering their earnings estimates as earnings season approaches. Over the last 10 years, analysts lower their earnings estimates by an average of 2.7% in the month before earnings get reported. In other words, history says that estimates for the coming earnings season should have been coming down during the month of September…
But that hasn’t happened.
In fact, analysts have been raising their estimates for the coming earnings season.
Analysts have also been increasing the number of “buy” ratings they have on individual stocks, per this nifty chart from Factset.com:
Factset would also like you to know about the companies with the highest percentage of “BUY” ratings:
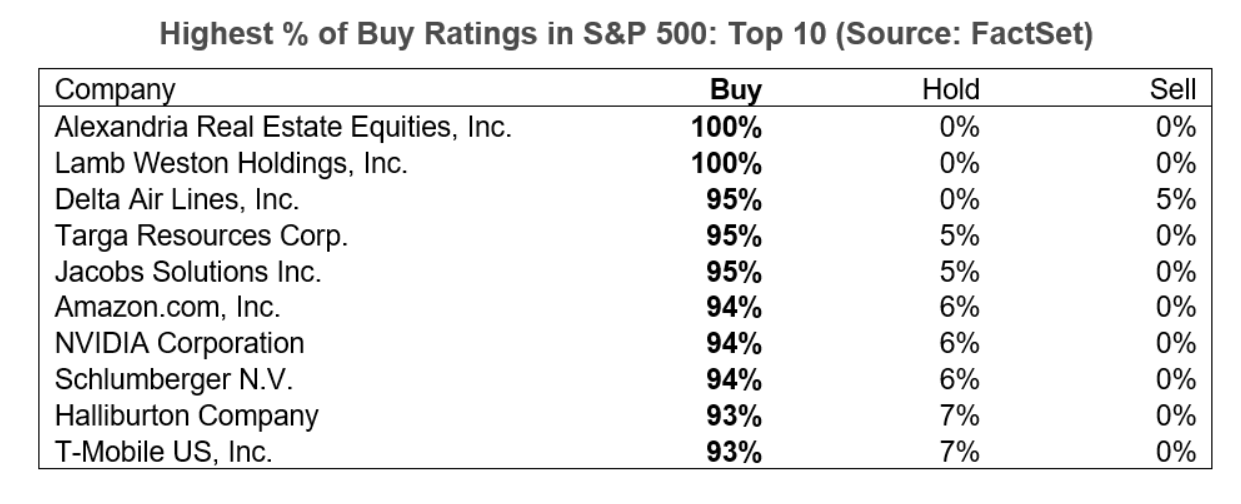
Amazon (NASDAQ: AMZN), interesting. T-Mobile (NASDAQ: TMUS) too…
The Pro Trader Today Portfolio
Last week, Dave and I added a portfolio for all of my recommended stocks from the last year. It’s right here.
If you’re looking for some ideas for an end of year rally, I have some (surprise!). I’ll share some quickly. Some from the portfolio, some not:
Rivian (NASDAQ: RIVN) – last week’s beatdown was overdone. Back to the low- to mid-$20s is likely.
Fisker (NYSE: FSR) – I really like it around $6. Could be $8 by the end of the year.
Albemarle (NYSE: ALB) – the stock has been crushed. Forward P/E is now 6. I know there’s a potential activist investor buying into ALB’s acquisition target the Australian lithium miner, Lionstown. But I’m not sure that’s enough reason for the stock to be trading at 2-year lows.
AMD (NYSE: AMD) – AMD showed impressive relative strength last week, rallying ~7% while the S&P 500 hammered out a “pretty, pretty good” bottom. Next move could be powerful.
Bank of America (NYSE: BAC) – stock has been crushed to $26, last week some were even suggesting the bond yields were spiking because BAC is having Silicon Valley Bank-like problems. Please.
Teradyne (NYSE: TER) – It’s muddled around since I wrote it up on September 27. Just remember: 50% earnings growth coming in 2024.
Ok that’s what I got for you today, take care and I’ll talk to you on Wednesday,
Briton Ryle
Chief Investment Strategist
Pro Trader Today
brit.ryle@protradertoday.com
Facebook: https://www.facebook.com/ProTraderToday
Twitter: https://twitter.com/BritonRyle